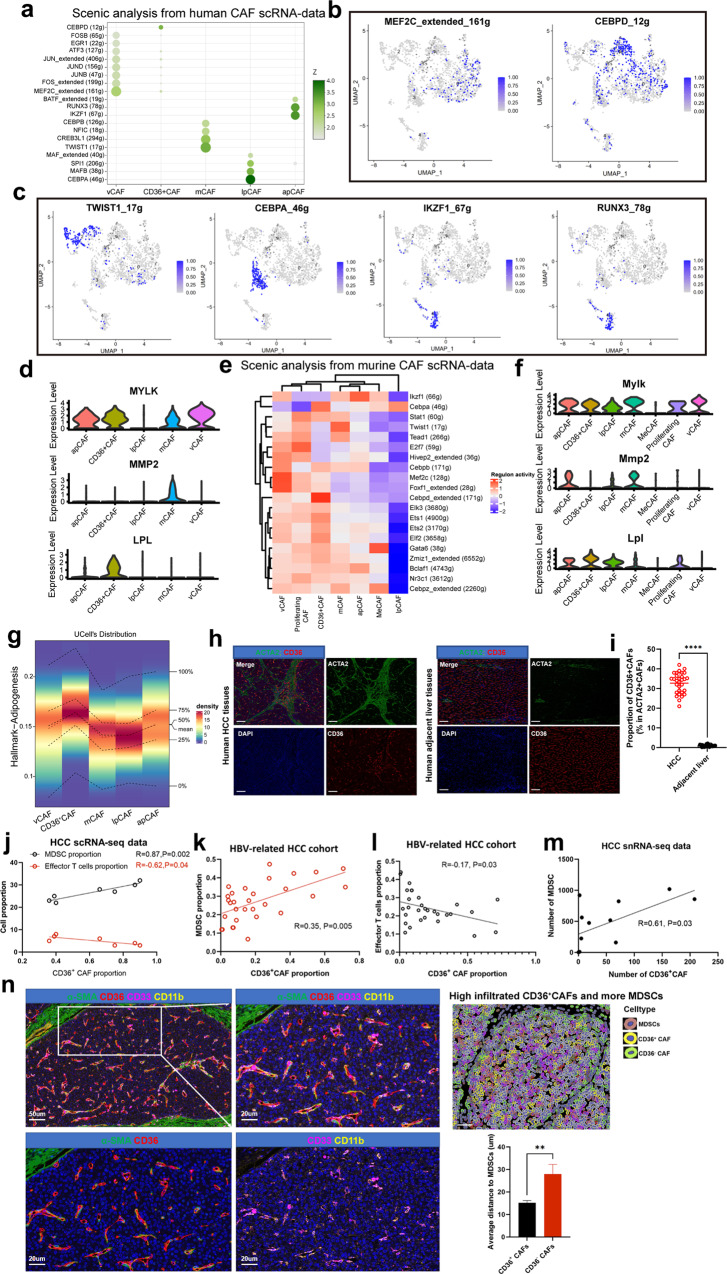
Fig. 3. CAF subtype-specific TFs and the interactions between different CAFs and MDSCs.
a Dotplot shows transcriptional factors enriched in different human CAF subclusters. b, c UMAP plots show top expressed TFs from CAF clusters. d Violin plots show targeted genes from TFs in human CAF clusters. e Heatmap show TFs enriched in different murine CAF subclusters. f Violin plots show targeted genes from TFs in murine CAF clusters. g The activity of adipogenesis pathway gene signatures in different human CAF subclusters. h, i The mIF show CD36+CAFs significantly enriched in human HCC than adjacent liver tissues. j The correlation between CD36+CAFs and MDSCs, effector CD8+T cells from scRNA-seq data. k The correlation between CD36+CAFs and MDSCs in HBV-related HCC cohort. l The correlation between CD36+CAFs and effector CD8+T cells in HBV-related HCC cohort. m The correlation between CD36+CAFs and MDSCs from snRNA-seq data. n MIF staining showed CD36+CAFs interacted with MDSCs in closer proximity. Data shown as mean ± S.E.M., one-way ANOVA following multiple comparison test was used, ***P < 0.001, **P < 0.01, *P < 0.05, and ns not significant.

