
Figure 2.
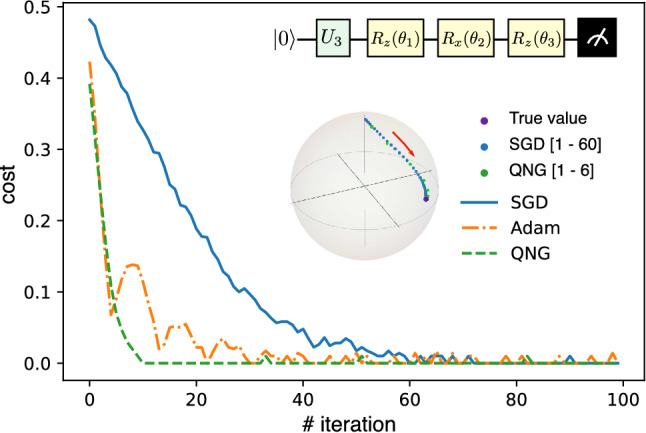
Single-qubit tomography. Cost function versus the number of iterations for difference optimizers: SGD (blue), Adam (orange), and QNG (green). Inset 1: quantum circuit for a single-qubit tomography where an unknown qubit state is generated by a random unitary , and is made up of , , and gates. Inset 2: Bloch sphere represents the qubit states: violet circle: the true state, blue circle: the trajectory of the reconstructed state under the SGD optimizer for the iterations run from 1 to 60, green circle: the trajectory under the QNG optimizer for the iteration runs from 1 to 6.