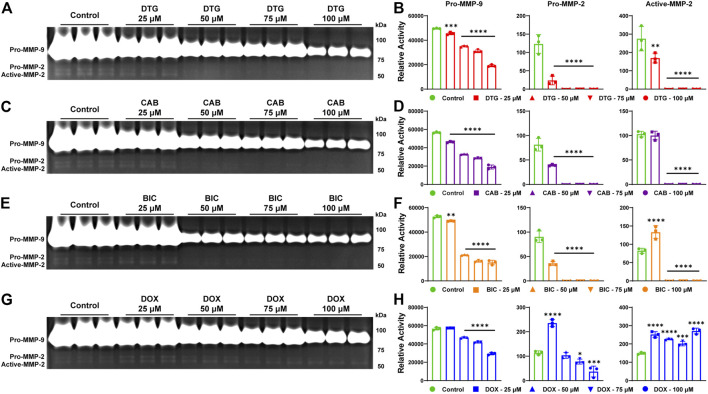
FIGURE 2.
Inhibition of MMPs by INSTIs. (A, C, E, and G) Gelatin zymogram. Activity of MMP-2 and MMP-9 was evaluated in serum-free medium of THP-1 cells following treatment with DTG, CAB, BIC or DOX (25, 50, 75 or 100 µM). Vehicle treated cells were used as controls. (B, D, F, and H) Relative activity of MMP-9 or -2 was measured following treatment with DTG, CAB, BIC or DOX. A one-way ANOVA followed by Dunnett’s test was used to compare activity of individual MMP between each treatment concentration of individual drug and respective control (*p < 0.05, **p < 0.01, ***p < 0.001, ***p < 0.0001). Data are expressed as the mean ± SEM, N = 3 biological replicates. Experiments were repeated independently three times with equivalent results.

