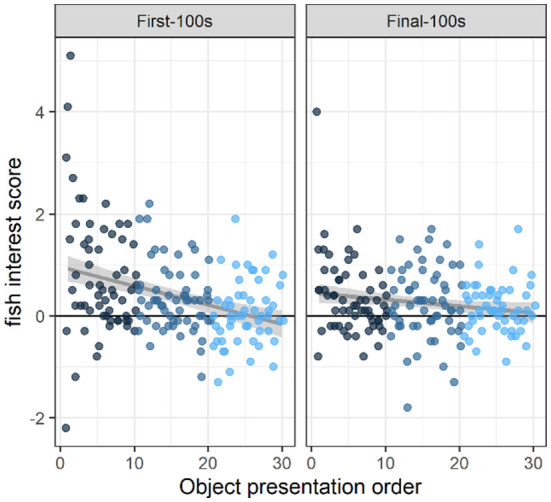
Figure 2.

Interest across novel object presentations. Fish interest scores were calculated as the difference in the average number of fish in the inner area (within two body-lengths of the object) during the object presentation period vs. a baseline period when there was no object present. These data show that fish were significantly attracted to the novel object at the beginning of the study (i.e., the first 10 objects they saw) during the first-100 s of an object presentation (p < 0.0001) and during the final-100 s of object presentation (p < 0.01). By the end of the study, (i.e., the last 10 objects they saw), there was no strong evidence of overall attraction to (or avoidance of) the novel object area (p's > 0.05). Across presentations, therefore, interest in the novel objects decreased during both periods (first-100s: p < 0.0001; and final-100s: p < 0.02). Dots indicate the number of fish in the object area above the average number of fish in the object area during baseline. Dots are colored according to object presentation order (dark blue: 1–10; medium blue: 11–20; light blue: 21–30) and are jittered slightly (random noise added to avoid overlapping). Gray lines and shaded areas represent the best linear fit and its 95% Confidence Interval.
