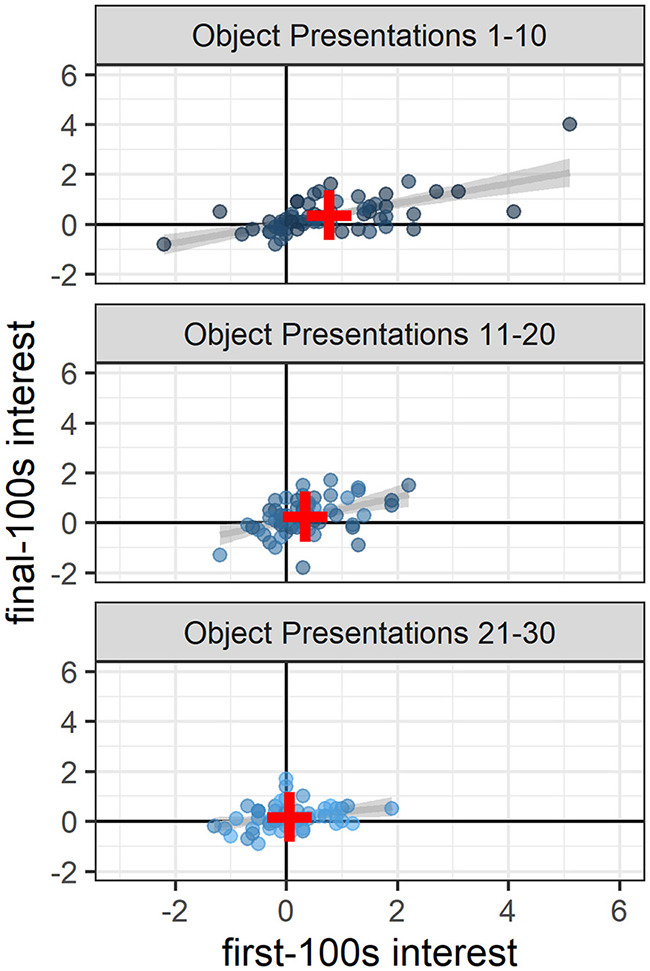
Figure 3.

Sustained interest across the 10 min of novel object presentations. Throughout the study, high interest in the first 100 s generally corresponded to high interest in the final 100 s of the 10-min novel object presentations (presentations 1–10: p < 0.0001; presentations 11–20: p < 0.001; presentations 21–30 p < 0.02). Dots indicate the number of fish in the object area above the average number of fish in the object area during baseline and are colored according to object presentation order (dark blue: 1–10; medium blue: 11–20; light blue: 21–30). Gray lines and shaded areas represent the best linear fit and its 95% Confidence Interval. Red plus symbols indicate the center of each bivariate distribution (see online version for color).
