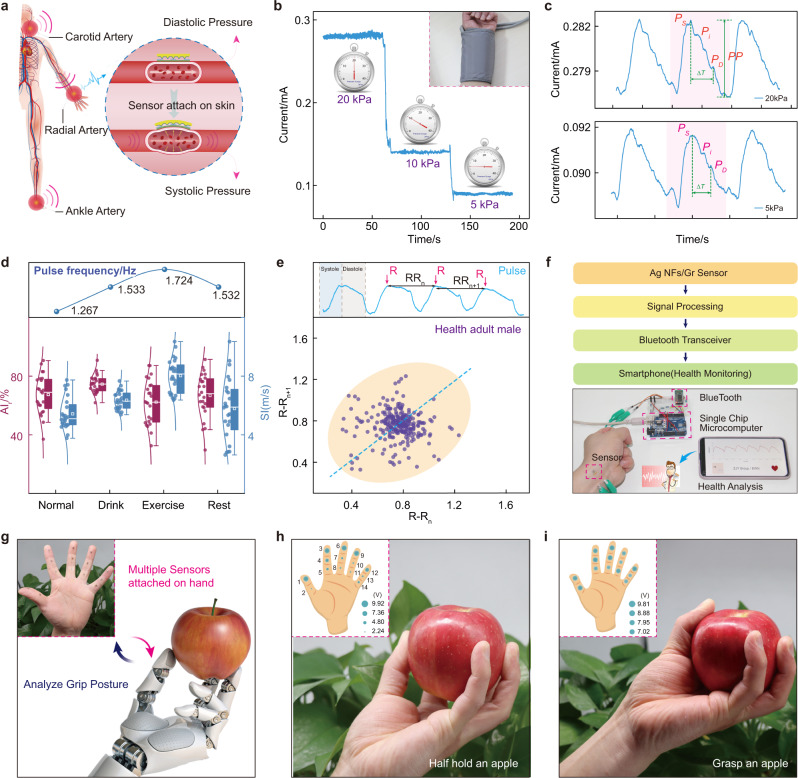
Fig. 4. Real-time detection of human pulse and analysis of grasping posture.
a Schematic diagram of sensors attached to the various arteries and the principle to detect the systolic and diastolic pressure. b Pulse signal detected with different external pressures. Inset: using a blood pressure cuff to apply pressure. c Extracted interpreted pulse waveforms under the pressure of 20 and 5 kPa. d Augmentation index (AIx), reflection index (RI), and frequency of the pulse waveforms in different states, including drinking, exercise, and rest. Top: Pulse frequency variation obtained by Fourier transform. e Poincare plot of a 25-year-old male for a long-term pulse detection of 200 s. f Real-time pulse wave shown on a smart phone via App interface for human health monitoring. g Multiple sensors attached to the front of the finger to detect the different grasping postures. The sensors at fingertip have large voltage with a half hold apple (h), and all sensors have a higher voltage when the apple is fully grasped (i).

