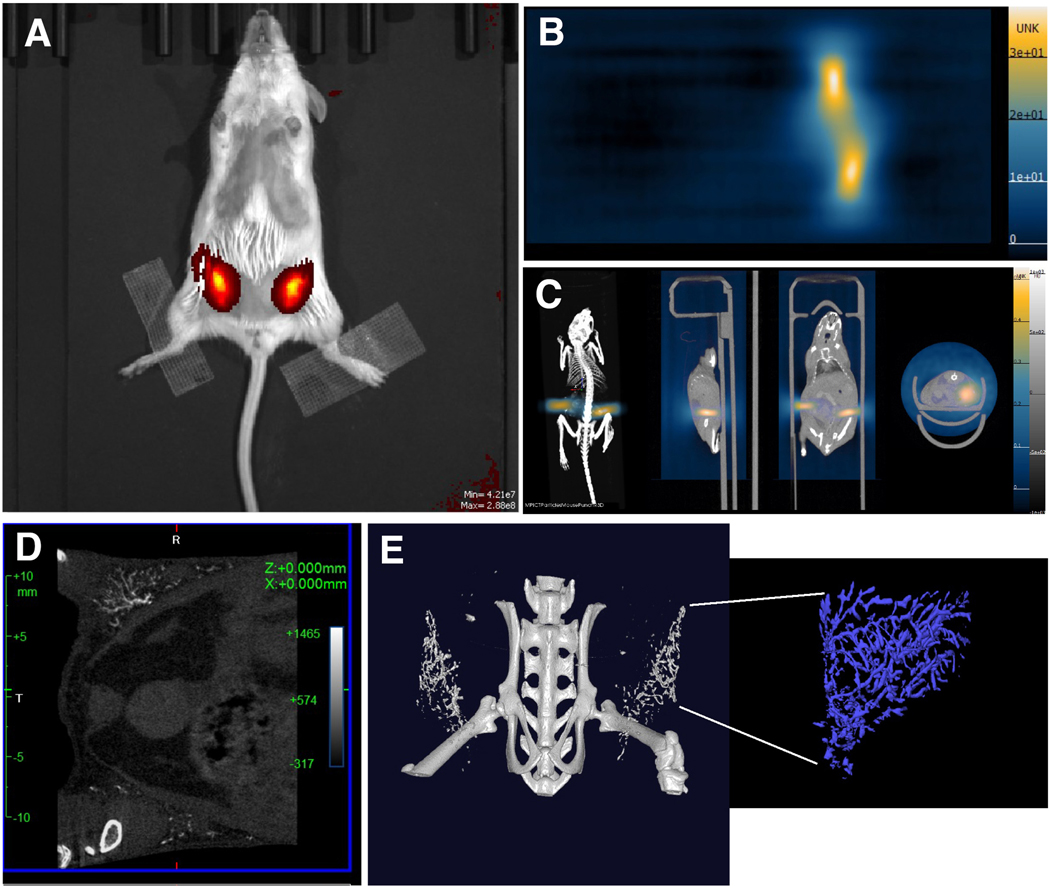
Figure 4.
Multimodal imaging of omniparticles after intraductal injection. A) Fluorescence imaging with the Cy5.5 fluorophore-labeled omnipartcles shows localization of the agent; B) 2D and C) 3D (overlayed with CT) MPI images showing signal generation due to the particle core. D) 2D and E) 3D CT images showing the intricate detail of the ductal tree network (blue color is optimized for visualization of ductal tree).

