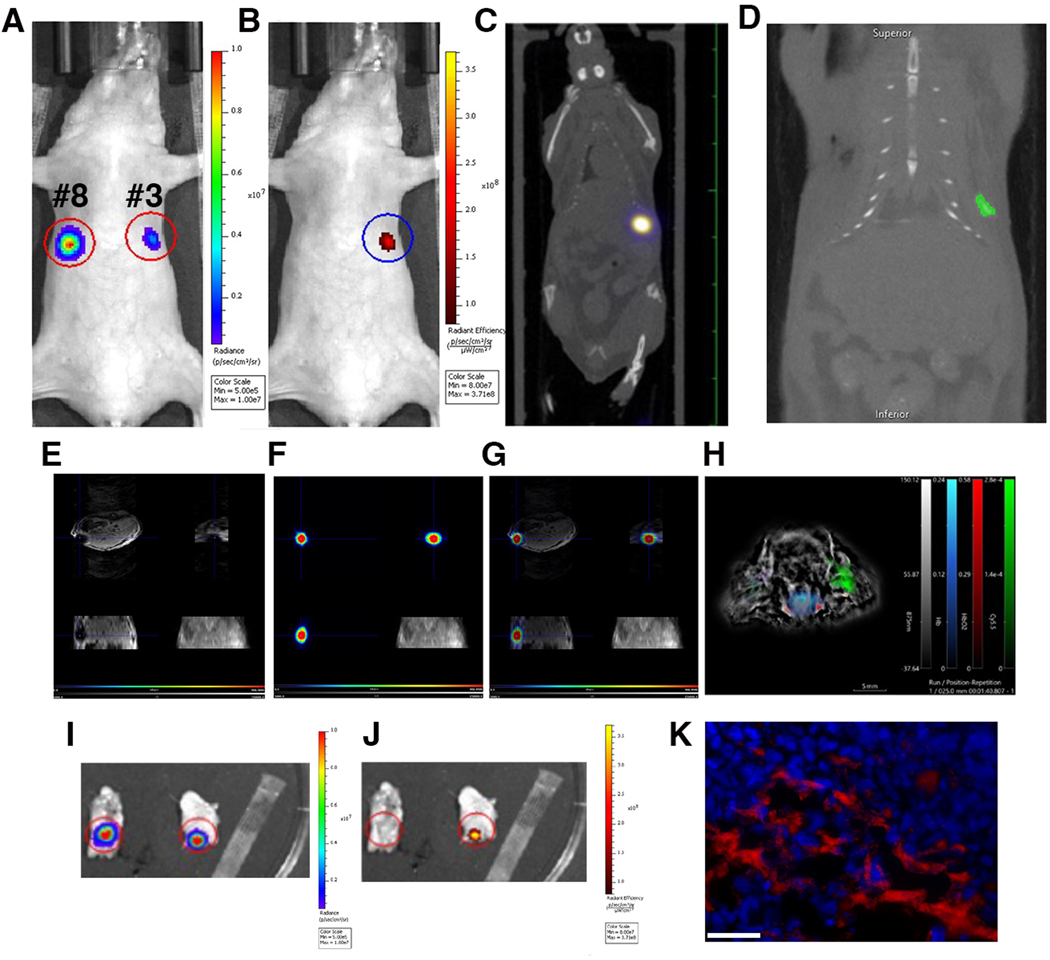
Figure 6.
In vivo imaging of labeled tumor cells injected in the mammary fat pad. A) In vivo bioluminescence imaging of the cells injected in mammary fat pads #3 and #8. B) In vivo fluorescence imaging showing the presence of the labeled cells in the mammary fat pad #3. C) In vivo MPI demonstrating the presence of the signal. D) 2D CT demonstrates the presence of the labeled cells. E) In vivo MRI images showing signal generation due to the presence of the particle core in labeled cells. F) In vivo PET imaging. G) Merged MRI and PET. MRI and PET images are showing (clockwise) axial, saggital and coronal view and maximum intensity projection. H). Optoacoustic imaging showing generation of the signal in the fat pad injected with labeled cells. I) Ex vivo BLI imaging and J) FL imaging (right) of the excised tissue showing generation of the signal from the injected labeled cells. K) Correlative fluorescence microscopy demonstrating the presence of the omniparticle construct inside the labeled tumor cells. Bar=50μm.

