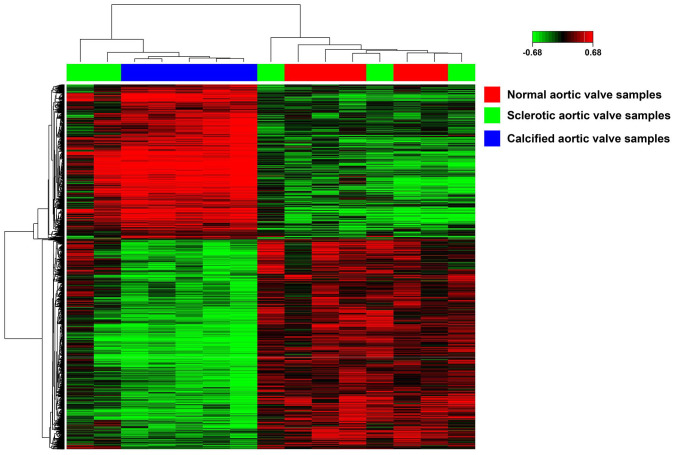
Figure 1.
The heatmap of DEGs. Sample names are displayed on the horizontal axis. Red represents normal, green represents calcified and green represents sclerotic aortic valve samples. Clusters of DEGs are presented on the left vertical axis, and the clusters of samples are shown on the above horizontal axis. Red represents up-regulated genes and green indicated downregulated genes.

