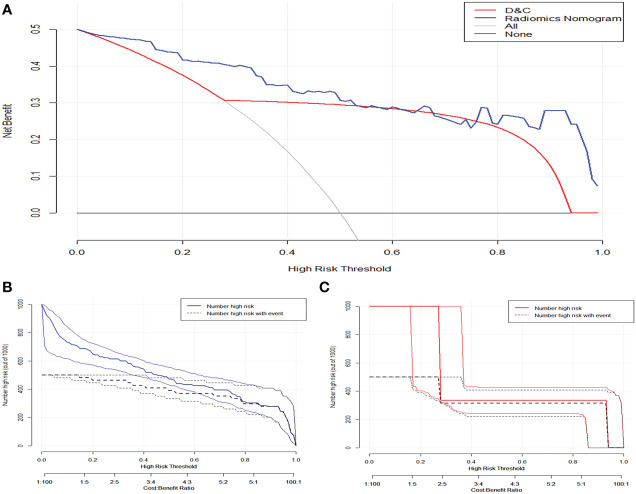
Figure 6.
(A) The clinical decision curve demonstrated that nomogram has higher net benefits than preoperative curettage at a threshold probability of 0–0.47 and > 0.67. The solid blue and orange lines in figures (B) and (C) represent the clinical impact curves of the nomogram and the actual preoperative DC, respectively. The black dashed line represents the postoperative pathological results of patients with endometrial cancer, and the closer the solid line is to the black dashed line, the better the prediction effect.

