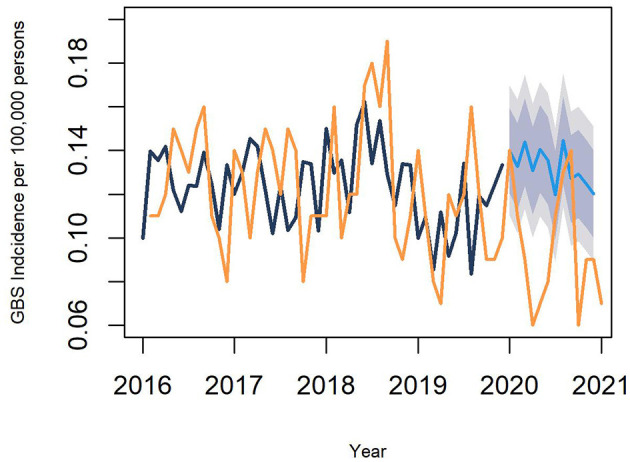
Figure 2.

Incidence of GBS predicted by an autoregressive integrated moving average model. The orange line denotes the observed incidence and the black line is fitted by removing a seasonal variation from the observed incidence. The blue line denotes the predicted incidence during the COVID-19 pandemic, and the blue shades represent 80 and 95% CIs of the predicted incidence during the pandemic. GBS, Guillain–Barré syndrome.
