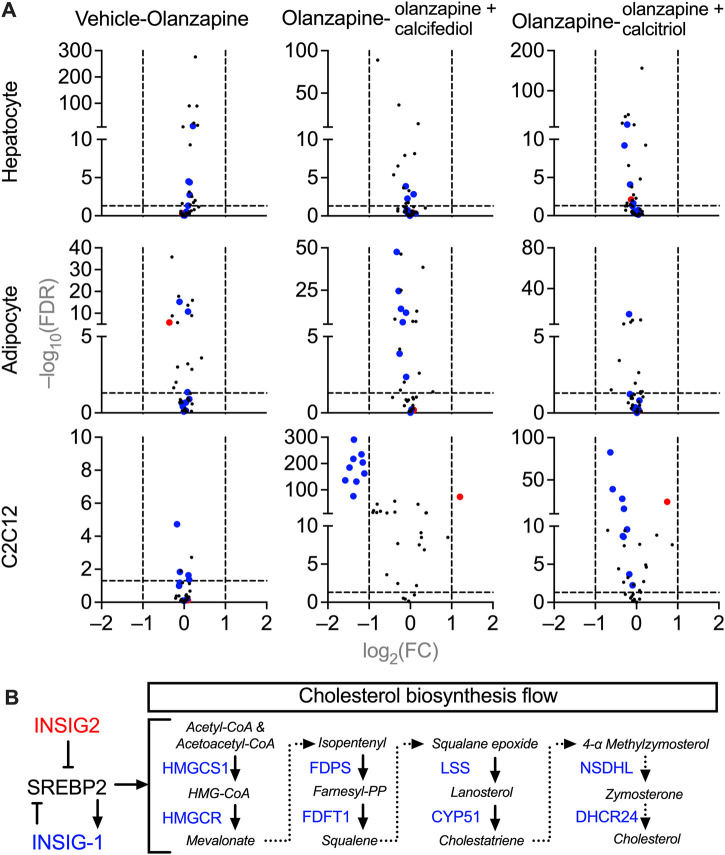
FIGURE 5.
Volcano plots of gene expression in the cultured mice cells treated with vehicle, olanzapine, or olanzapine co-treated with calcifediol or calcitriol. The changing ranges were expressed as log2-transformed fold-change (FC), and the significance was expressed as −log10-transformed false discovery rate (FDR). (A) Demonstrations of the cholesterol biosynthesis-related gene changes under olanzapine treatment and calcifediol or calcitriol-olanzapine co-treatment. The genes significantly downregulated in the olanzapine-calcifediol co-treated C2C12 cells are tagged with blue dots, and the genes upregulated are tagged with red dots in all the data sets. (B) A schematic diagram illustrating the functions of downregulated genes (blue) and upregulated gene (red) in the process of cholesterol biosynthesis. Genes plotted with FC absolute value > 2 and FDR value > 0.05 were considered to be significantly changed by treatment.

