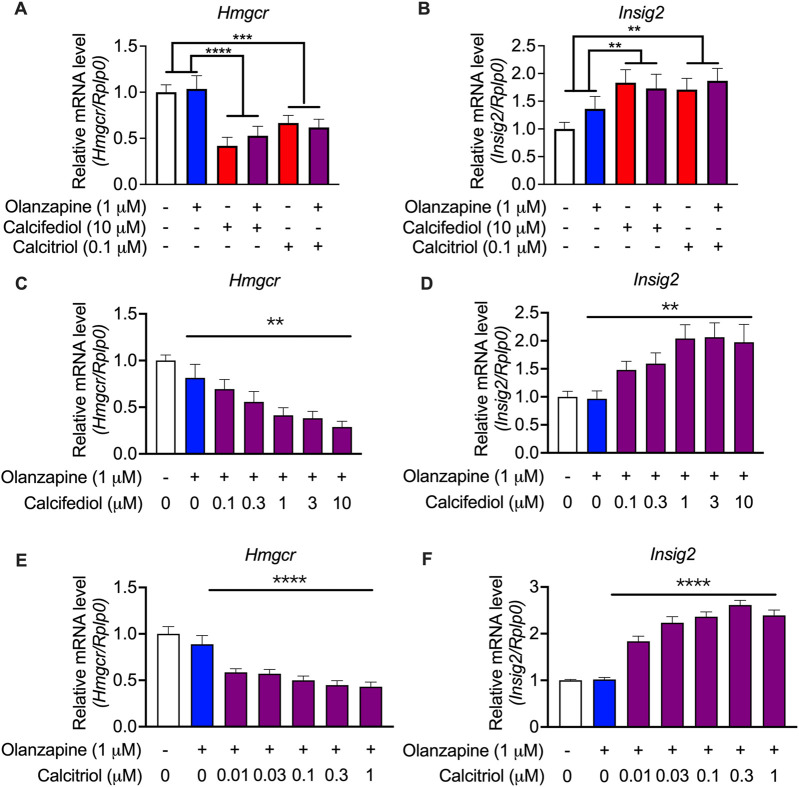
FIGURE 6.
Validation by quantitative RT-PCR results showing the expression of cholesterol biosynthesis-associated genes in the cultured C2C12 cell line. (A) 3-hydroxy-3-methylglutaryl-CoA reductase (Hmgcr) and (B) Insulin-induced gene 2 (Insig2) were validated in the same treating condition as that in the RNA-seq experiments (n = 12). Results were normalized to ribosomal protein, large, P0 (Rplp0). (C) Hmgcr and (D) Insig2 were validated in calcifediol with gradient-changed concentrations increasing from 0 to 10 μM (n = 8–9). (E) Hmgcr and (F) Insig2 were validated in calcitriol with gradient-changed concentrations increasing from 0.01 μM to 1 μM. Data are shown as means ± SEM (n = 9). **p < 0.01, ****p < 0.0001. The comparisons of olanzapine and vitamin D influences were compared by two-way analysis of variance (ANOVA). The validation of the dose-dependent effects of calcifediol and calcitriol were compared by one-way ANOVA.

