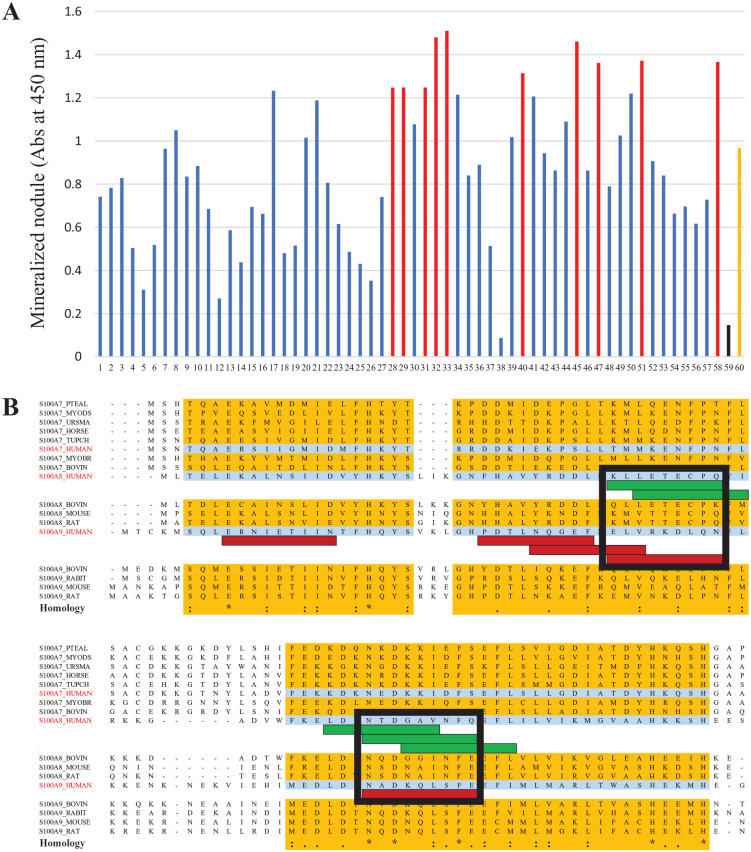
Figure 2.
Identification of functional peptides by the peptide array method. (A) Quantitative analysis of alizarin red staining. Red bars represent 10 peptides with the highest mineralization-inducing ability (Nos. 28, 29, 31, 32, 33, 40, 45, 47, 51, and 58). Black bar represents a random peptide (No. 59). Orange bar represents a Bone Morphogenetic Protein 2 (BMP2)-derived peptide (No. 60). (B) Selection of final candidate peptides based on additional sequence alignment information. Green bar represents an S100A8-derived peptide and red bar represents an S100A9-derived peptide. Because there were 2 overlapping sites in the sequence alignment, multiple peptides were selected from S100A8 and S100A9 (black squares); from these groups of multiple peptides, 4 final candidate peptides were selected (KLLETECPQ, ELVRKDLQN, NTDGAVNFQ, and NTDGAVNFQ).

