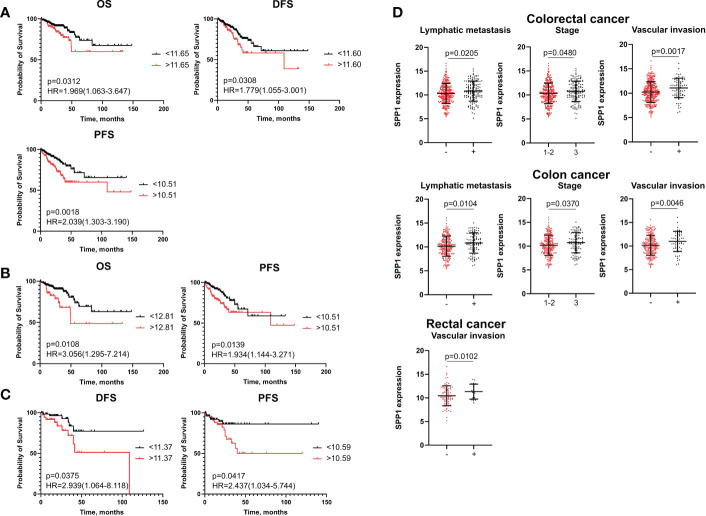
Figure 3.
SPP1 mRNA expression is associated with poor survival and clinical-pathological parameters. (A) Kaplan–Meier curve of TCGA survival data (OS, DFS, and PFS) for high-risk and low-risk patients in combined CRC group. (B) Kaplan–Meier curve of TCGA survival data (OS and PFS) for high-risk and low-risk groups in colon cancer patients. (C) Kaplan–Meier curve of TCGA survival data (DFS and PFS) for high-risk and low-risk groups in rectal cancer patients. Log-rank test p-values are shown in Kaplan–Meier curves. (D) SPP1 mRNA expression is associated with lymph node, tumor stage and vascular invasion in CRC patients and colon cancer patients, and with vascular invasion in rectal cancer patients. Student’s t-test was applied. Scatter plots depict gene expression as mean with SD.

