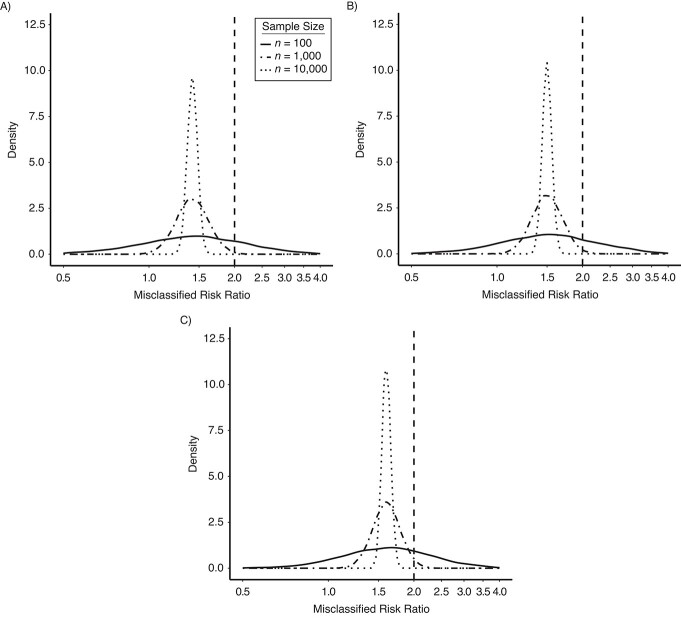
Figure 1.
Results from an observation-level simulation of nondifferential exposure misclassification, using 3 example data sets of varying sizes (Table 1) and a range of sensitivities. The figure shows density plots of the misclassified risk ratios (RRs) from 10,000 simulations. We simulated the classified version of exposure by drawing from binomial distributions with probabilities equal to the specified specificity and sensitivity. Each analysis was repeated at 3 different sample sizes but with the true RR equal to 2.0 and the same distribution of the exposure and outcome in each. A) Exposure specificity = 90%; exposure sensitivity = 80%; true RR = 2.0. B) Exposure specificity = 90%; exposure sensitivity = 70%; true RR = 2.0. C) Exposure specificity = 90%; exposure sensitivity = 60%; true RR = 2.0. The vertical dashed line denotes the true RR (RR = 2.0) in each panel. The mode of the density distribution for simulations with 100 participants is slightly shifted compared with simulations with 1,000 or 10,000 participants because binomial sampling does not allow for decimal fractions; smaller sample sizes are more sensitive to the discrete nature of the binomial distribution.

