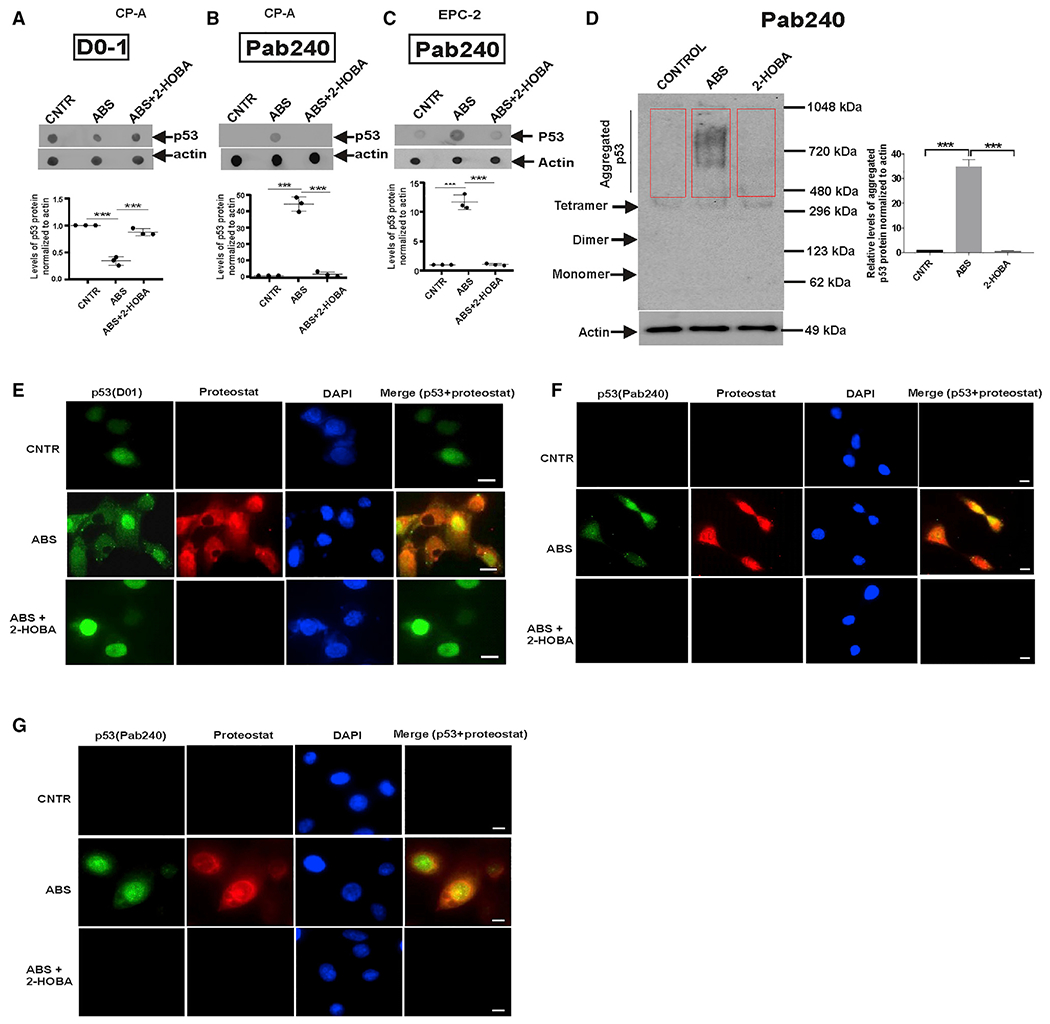
Figure 5. ABS treatment causes conformation change of the p53 protein molecule.

(A) Dot blot analysis of CP-A cell extracts using D01 antibody.
(B) The same as (A) but p53 (PAb 240) antibody was used. Staining was higher in cells treated with ABS than in control or 2-HOBA-treated cells (***p < 0.001; n = 3; Tukey’s multiple comparison).
(C) The same as (B) but EPC-2 cells were studied (ABS versus ABS+2-HOBA, ***p < 0.001; n = 3; Tukey’s multiple comparison).
(D) Native blue PAGE demonstrates misfolding and aggregation of p53 protein in CP-A cells collected after treatment with ABS. The graph shows the densitometric measurement of p53 aggregation detected by p53 (PAb 240) antibody (control versus ABS, ***p < 0.001; ABS versus 2-HOBA, ***p < 0.001; n = 3; Tukey’s multiple comparison). Aggregated p53 proteins are indicated by a red box. Protein expression in control cells was arbitrarily set at 1.
(E) Representative images show co-localization of p53 protein with ProteoStat-positive aggregates (scale bar, 5 μm). p53 was analyzed with p53(D0-1) and ProteoStat dye was used to identify protein aggregates in CP-A cells treated with ABS alone or in combination with 2-HOBA (n = 3).
(F) The same as (E) but PAb 240 antibody was used for detection of misfolded p53 protein (scale bar, 5 μm).
(G) The same as (F) but the p53 misfolding was analyzed in EPC-2 cells. All results are expressed as mean ± SD.
