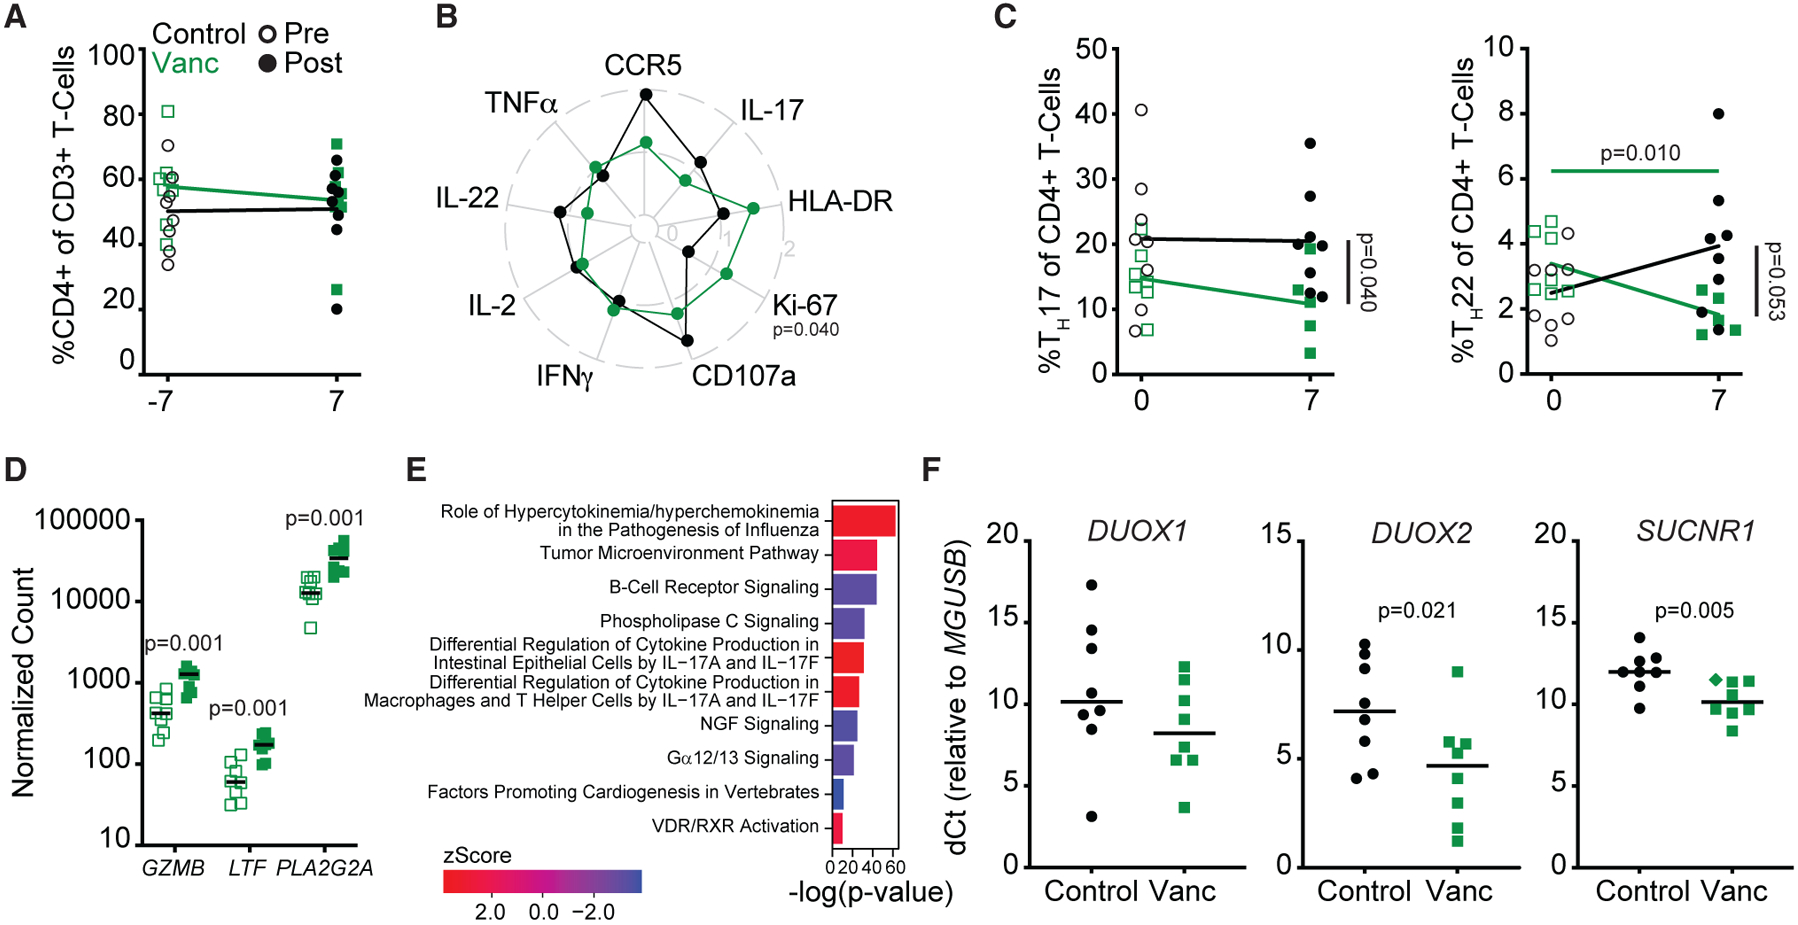
Figure 2. Vanc treatment disrupts intestinal antimicrobial immunity in healthy macaques.

(A) Longitudinal, rectal CD4+ T cell frequencies.
(B) Radar plot depicting fold change from baseline (post- versus pre-Vanc) expression of rectal CD4+ TM activation markers and stimulation-induced cytokines.
(C) Longitudinal rectal TH17 (left) and TH22 (right) cell frequencies.
(D) NanoString-quantified counts of the top three rectal genes identified as longitudinally, differentially expressed in response to Vanc.
(E) p values and Z scores of the top 5 longitudinally increased and decreased pathways (Z score >|±2|) as identified by IPA from NanoString-quantified transcript counts in rectal homogenates.
(F) Relative expression of DUOX1, DUOX2, and SUCNR1 in rectal homogenates post-Vanc. Diamond denotes undetected transcript normalized to the limit of detection.
Lines in (A)–(D) and (F) represent mean per group. Data points are derived from 1 biological replicate, n = 5–8 per group. Significance methods as follows: unpaired or paired two-way t tests (A–D and F) and Fisher’s exact test (E). Horizontal p values color coded by group with longitudinal significance. Vertical p value denotes significance post-treatment.
