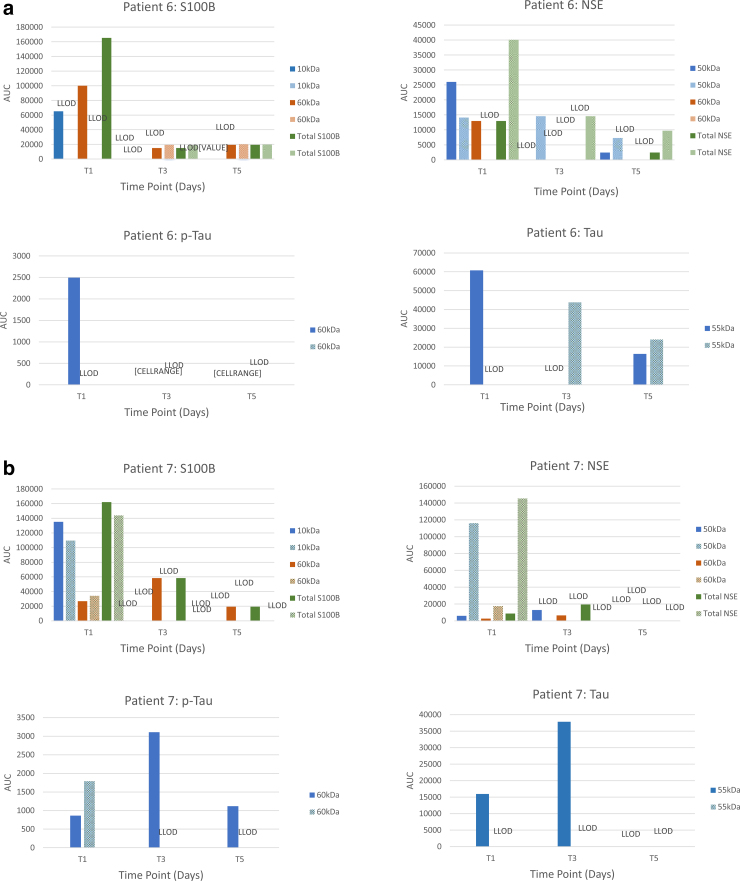
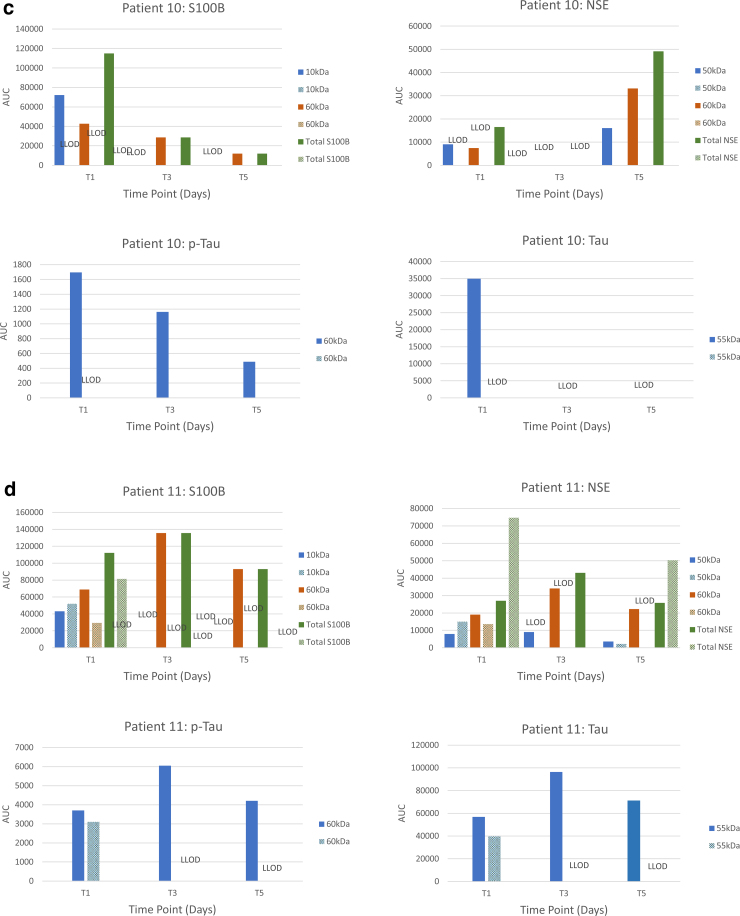
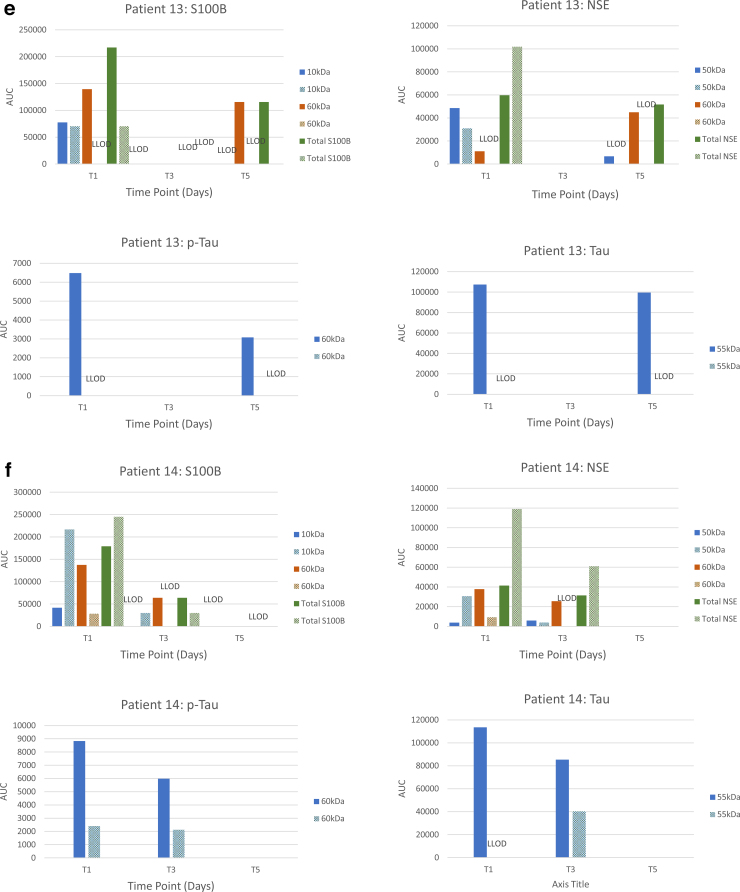
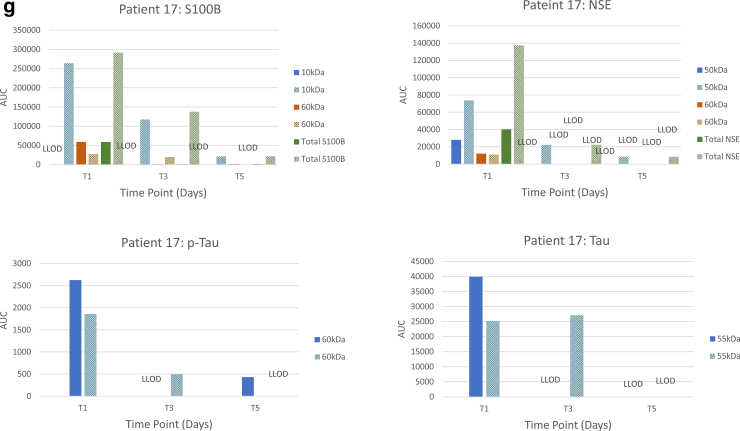
FIG. 2.
Time-dependent changes in the protein biomarker values of matching CSF and bECF samples in the individual patients (A, patient 6; B, patient 7, C, patient 10; D, patient 11; E, patient 13; F, patient 14; G, patient 17). Pay attention to the scales. The scales reflect the relative abundance of proteins and vary substantially between proteins and biosamples. AUC, area under the curve; bECF, brain extracellular fluid; CSF, cerebrospinal fluid; LLOD, lower limit of detection.


