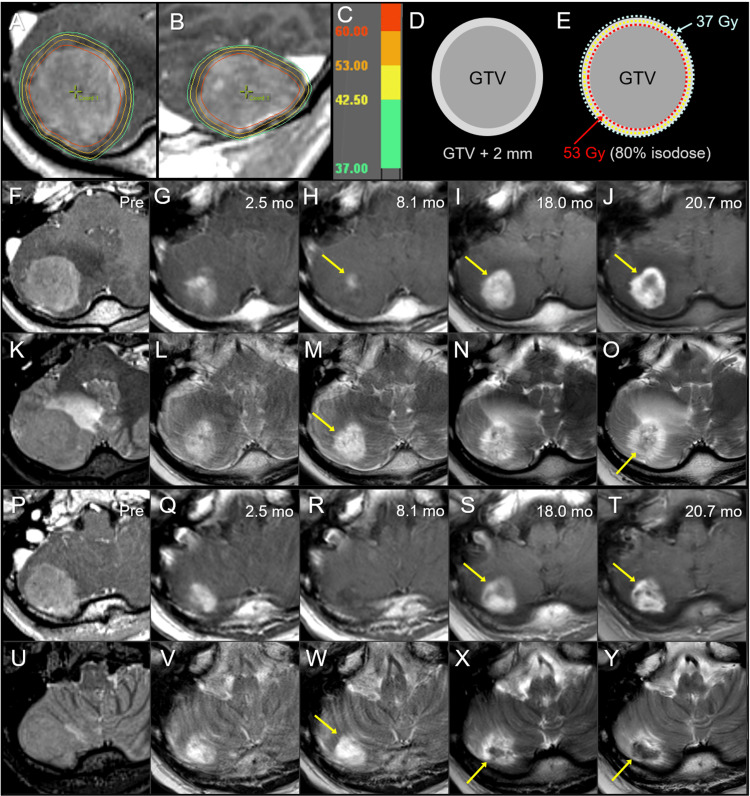
Figure 4. Case 3: Dose distribution, planning design, and images before and after 10-fraction stereotactic radiosurgery.
The images show (A, B) dose distributions (A: axial view; B: sagittal view); corresponding isodoses (C); schema of GTV and object volume for dose evaluation: GTV + 2 mm (D); schema of treatment planning (E); axial views at the plane of initial GTV center (F-O); axial views at the more caudal plane (P-Y); CE-T1-WI (F-J, P-T); T2-WI (K-O, U-Y); six days before the initiation of SRS (Pre) (F, K, P, U); at 2.5 months (mo) after the initiation of SRS (G, L, Q, V); at 8.1 months (H, M, R, W); at 18.0 months (I, N, S, X); and at 20.7 months (J, O, T, Y).
(A, B) The D66% of the GTV is 62 Gy (red), in which DX% indicates the dose irradiated to at least X% of the volume. (E) 53 Gy is prescribed to 80% IDS encompassing the GTV boundary, and the GTV + 2 mm boundary is simultaneously covered by 37 Gy. (G, L, Q, V) At 2.5 months, marked tumor regression is observed in which the iso-intensity mass in T2-WI almost disappeared, leaving a slight enhancement. (H, M, R, W) Subsequently, a marked discrepancy, i.e., T1/T2 mismatch, between the slightly enhancing lesion (arrow in H) and high-intensity tumor necrosis (arrows in M, W) is observed at 8.1 months. (I, N, S, X) At 18.0 months, enlargement of the enhancing lesion (arrows in I, S) up to the high-intensity lesion boundary on T2-WI and a low-intensity nodule on T2-WI (arrow in X) appeared. (J, O, T, Y) At 20.7 months, the low-intensity nodule (arrow in Y) enlarged, and an iso-intensity irregular mass (arrow in O) became noticeable, while the enhancing lesion (arrows in I, S), suggestive of the radiation effect, did not show significant enlargement (arrows in J, T).
GTV: gross tumor volume; CE: contrast-enhanced; T1-WI: T1-weighted image; T2-WI: T2-weighted image; SRS: stereotactic radiosurgery; IDS: isodose surface

