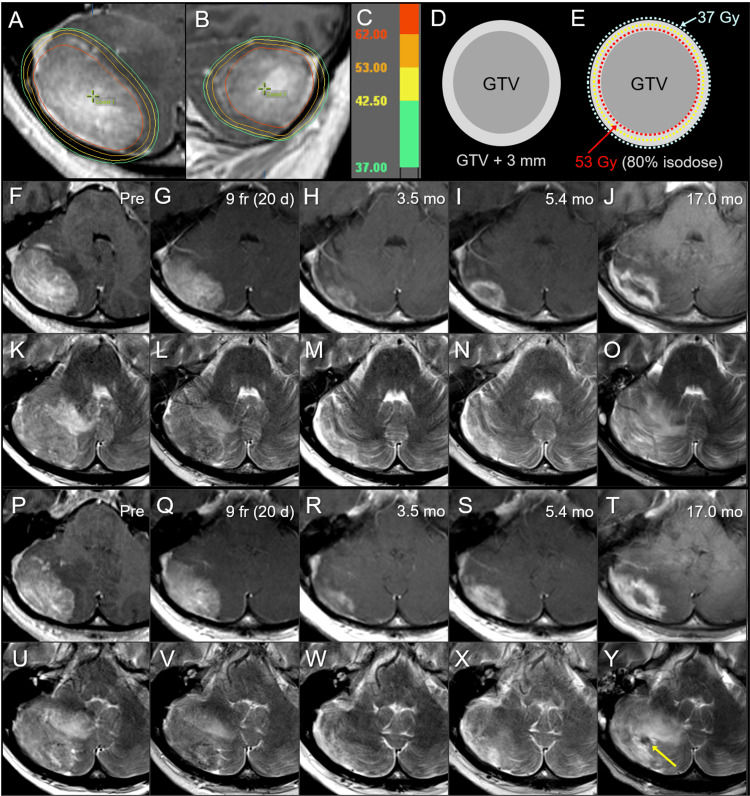
Figure 5. Case 4: Dose distribution, planning design, and images before and after 10-fraction stereotactic radiosurgery.
The images show (A, B) dose distributions (A: axial view; B: sagittal view); corresponding isodoses (C); schema of GTV and object volume for dose evaluation: GTV + 3 mm (D); schema of treatment planning (E); axial views at the plane of initial GTV center (F-O); axial views at the more caudal plane (P-Y); CE-T1-WI (F-J, P-T); T2-WI (K-O, U-Y); 10 days before the initiation of SRS (Pre) (F, K, P, U); at nine fractions (fr) and also 20 days (d) after pre-image acquisition (G, L, Q, V); at 3.5 months (mo) after the initiation of SRS (H, M, R, W); at 5.4 months (I, N, S, X); and at 17.0 months (J, O, T, Y).
(A, B) The D85% of GTV is 62 Gy (red); (E) 53 Gy is prescribed for 80% IDS that fully encompasses the GTV boundary, and the GTV + 3 mm boundary is simultaneously covered by 37 Gy, given the presumed brain invasion and the 10-day interval between image acquisition and SRS initiation. (G, L, Q, V) Slight tumor regression is observed at 9 fr. (G, L, Q, V) A marked decrease in the enhancing lesion and a visible mass on T2-WI are observed at 3.5 months. (I, N, S, X) The increase in enhancement without enlarging the nodule on T2-WI suggested a radiation effect at 5.4 months. (J, O, T, Y) Further enlargement of the enhancing lesion, a low-intensity nodule on T2-WI (arrow in Y), and aggravation of perilesional edema are observed at 17.0 months.
GTV: gross tumor volume; CE: contrast-enhanced; T1-WI: T1-weighted image; T2-WI: T2-weighted image; SRS: stereotactic radiosurgery; IDS: isodose surface

