Figure 2.
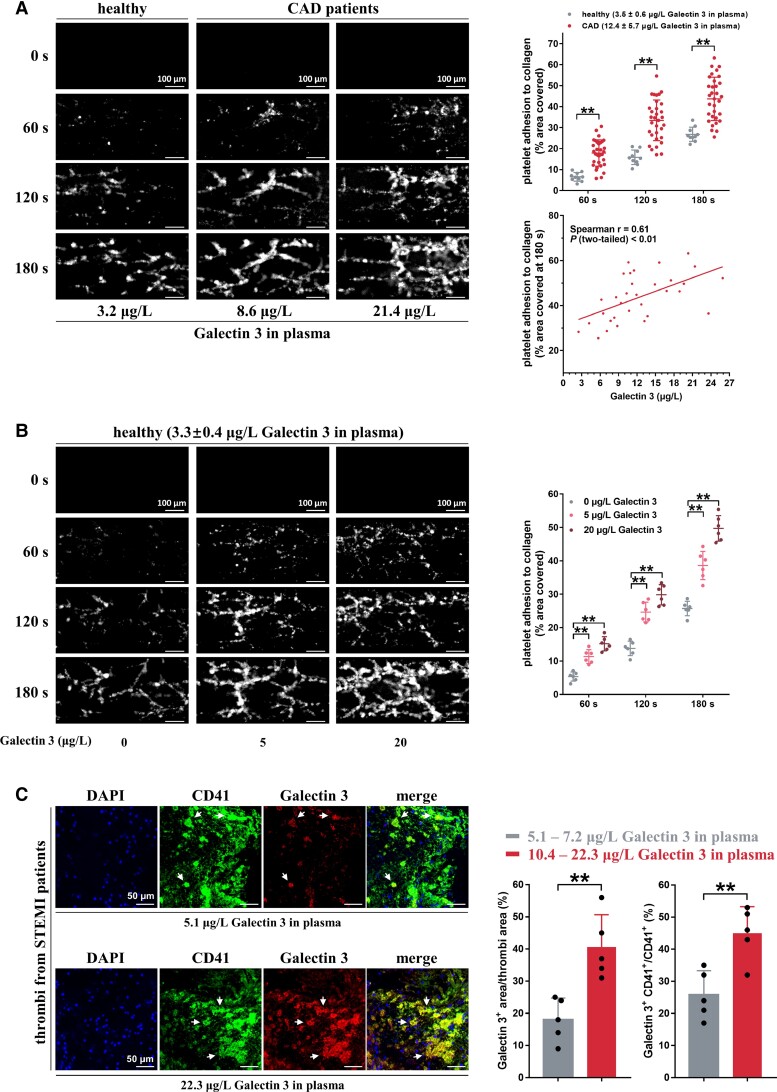
Galectin-3 directly potentiates in vitro thrombosis potential. (A) Whole blood from coronary artery disease patients showed accelerated thrombus formation over an immobilized collagen surface at a shear rate of 1000 s−1 compared with that of healthy subjects (n = 10). Thrombus formation area at 180 s correlated well with plasma Galectin-3 levels in coronary artery disease patients (n = 32). The whole blood was tagged by fluorescein isothiocyanate (FITC)-labeled anti-CD41 antibody, and then perfused through fibrillar collagen-coated bioflux plates for 180 s. Representative images of thrombus formation at the indicated time points are presented. Each solid circle represents the thrombus formation area from a single individual (Spearman correlation, GraphPad Prism 7). Scale bar = 100μm. (B) Recombinant Galectin-3, in a concentration-dependent manner, accelerated thrombus formation over an immobilized collagen surface at a shear rate of 1000 s−1. Whole blood samples from healthy subjects were preincubated with recombinant Galectin-3 and FITC-labeled anti-CD41 antibody and then perfused through fibrillar collagen-coated bioflux plates. Representative images of thrombus formation are presented. Each solid circle represents the thrombus formation area from a single individual (n = 6). Scale bar = 100μm. (C) Increased Galectin-3 deposition in the thrombi from ST-elevation myocardial infarction patients with high plasma Galectin-3 levels (10.4–22.3 μg/L; n = 5) compared with those from ST-elevation myocardial infarction patients with low plasma Galectin-3 levels (5.1–7.2 μg/L; n = 5). Dual-immunofluorescence staining was carried out using anti-CD41 antibody (a platelet marker, green fluorescence) and anti-Galectin-3 antibody (red fluorescence). Blue fluorescence indicates nuclei stained with 4′,6-diamidino-2-phenylindole. White arrows (yellow fluorescence) mark co-localization of Galectin-3 and CD41. Representative results of thrombi and summary data are presented. Scale bar = 50 μm. Statistical analyses were performed using two-way ANOVA followed by Sidak's multiple comparisons test in (A) and (B) and unpaired two-tailed Student's t-test in (C). **P < 0.01.

