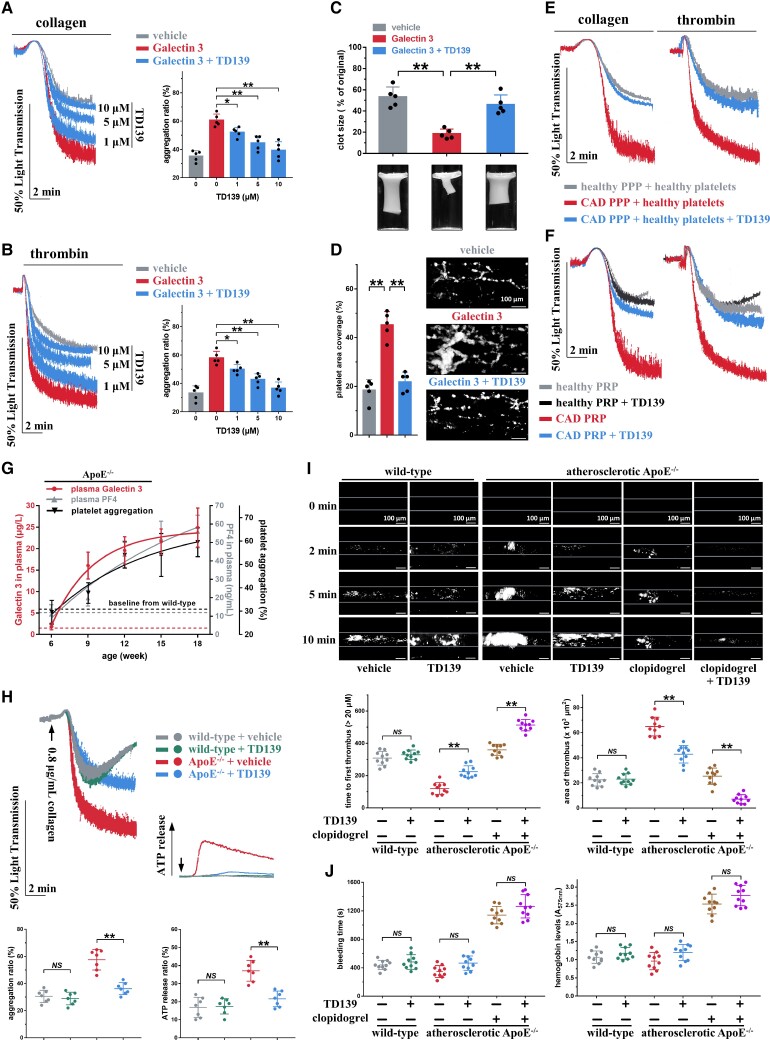
Figure 6.
TD139 inhibits the increased platelet aggregation induced by Galectin-3 and suppresses in vivo thrombosis potential in atherosclerotic ApoE−/− mice. (A and B) TD139, in a concentration-dependent manner, inhibited platelet aggregation induced by Galectin-3. Washed platelets from healthy subjects were pre-treated with TD139 (0–10 μM) and recombinant Galectin-3 (20 μg/L) for 5 min and then stimulated with collagen (0.2 μg/mL) or thrombin (0.02 U/mL). Representative results and summary data are presented (n = 5). (C) TD139 (10 μM, 5 min) suppressed the increased clot retraction induced by Galectin-3 using healthy washed platelets. Representative results and summary data are presented (n = 5). (D) TD139 (10 μM, 5 min) decreased thrombus formation induced by recombinant Galectin-3 (20 μg/L, 30 min) in whole blood from healthy subjects over an immobilized collagen surface at a shear rate of 1000 s−1. Representative results and summary data are presented (n = 5). Scale bar = 100 μm. (E) Healthy washed platelets presented enhanced platelet aggregation after preincubation with platelet-poor plasma from coronary artery disease patients with high plasma Galectin-3 levels, while the enhanced platelet aggregation was suppressed by TD139. Platelet-poor plasma from coronary artery disease patients (16.4 ± 3.1 μg/L plasma Galectin-3; n = 8) or healthy subjects (3.1 ± 0.5 μg/L plasma Galectin-3; n = 10) were prepared. Platelets from healthy subjects were resuspended within platelet-poor plasma for 10 min and then incubated with 10 μM TD139 for 5 min. Platelet aggregation was initiated by collagen (0.8 μg/mL) or thrombin (0.8 U/mL). Representative results and summary data (see Supplementary material online, Figure S15) are presented. (F) TD139 (10 μM, 30 min) inhibited platelet aggregation induced by collagen (0.8 μg/mL) or thrombin (0.8 U/mL) in platelet-rich plasma from coronary artery disease patients (17.6 ± 3.5 μg/L plasma Galectin-3; n = 8) without antiplatelet therapy but not in platelet-rich plasma from healthy subjects (3.3 ± 0.4 μg/L Galectin-3; n = 10). Representative results and summary data (see Supplementary material online, Figure S16) are presented. (G) Age-dependent increase in plasma Galectin-3 concentration, plasma PF4 concentration, and collagen-induced platelet aggregation in ApoE−/− mice at 6 weeks of age fed high-fat diet for 12 weeks was observed. Platelet-rich plasma was stimulated with 0.8 μg/mL collagen.Summary data are presented (n = 4, each time point). (H) TD139 inhibited ex vivo platelet aggregation and adenosine tri-phosphate release in platelet-rich plasma of atherosclerotic ApoE−/− mice but not in wild-type mice. Representative results and summary data are presented (n = 7). (I) TD139 suppressed FeCl3-induced thrombus formation in atherosclerotic ApoE−/− mice but not in wild-type mice. Thrombus formation in atherosclerotic ApoE−/− mice was inhibited more significantly by TD139 plus clopidogrel than by TD139 or clopidogrel alone. Representative results and summary data are presented (n = 10). Scale bar = 100μm. (J) TD139 had no effect on bleeding potential, as monitored by bleeding time and haemoglobin loss in atherosclerotic ApoE−/− mice and wild-type mice. TD139 did not increase the bleeding time and haemoglobin loss when combined with clopidogrel. The bleeding time and blood loss were measured (n = 10). For (H), (I), and (J), after 12 weeks of high-fat diet treatment, ApoE−/− mice randomly received vehicle or TD139 (15 mg/kg, i.p., twice at 12-h intervals) or clopidogrel (10 mg/kg, p.o., single dose), or TD139 (15 mg/kg, i.p., twice at 12-h intervals) plus clopidogrel (10 mg/kg, p.o., single dose). The subsequent experiments of 0.8 μg/mL collagen-induced platelet aggregation (H), FeCl3-induced thrombosis (I), and bleeding (J) were carried out at 30 min after the second TD139 administration or at 4 h after clopidogrel administration. Statistical analyses were performed using one-way ANOVA followed by Sidak's multiple comparison test in (B)–(J), and repeated measures one-way ANOVA followed by Sidak's multiple comparison test in (A). NS, no significance; *P < 0.05; **P < 0.01.

