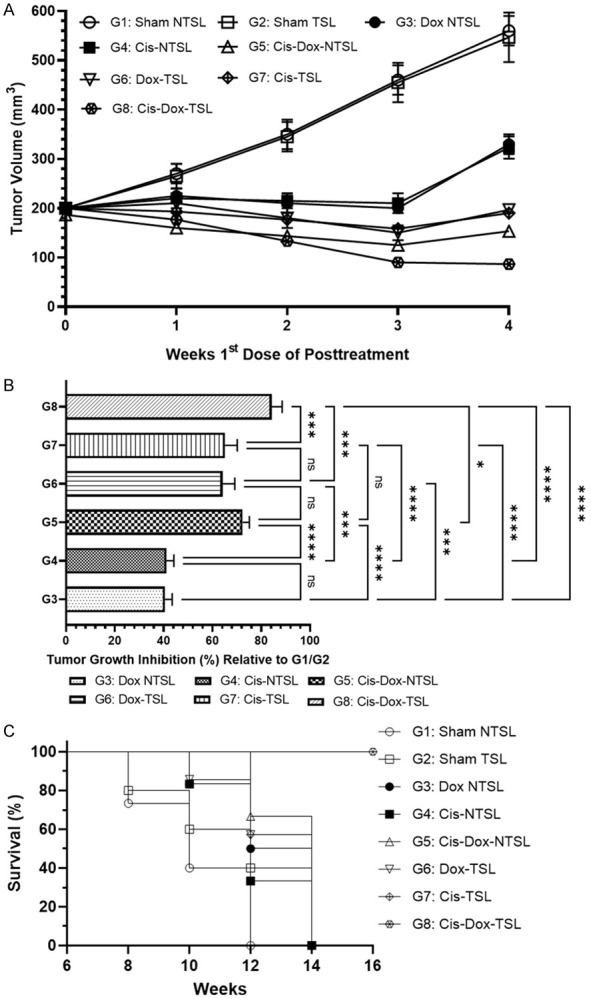
Figure 6.

Effect of various formulations of Cis and Dox on tumor growth in BaP induced fibrosarcoma. (A) Tumor size during the treatment, (B) Tumor inhibition relative to G1/G2, (C) Frequency of survival of the animals. The values are expressed as mean ± SD of 5 mice from each group. NSNo significance within the groups, ****Significant difference between the treated groups P<0.0001, ***Significant difference between the treated groups P<0.001.
