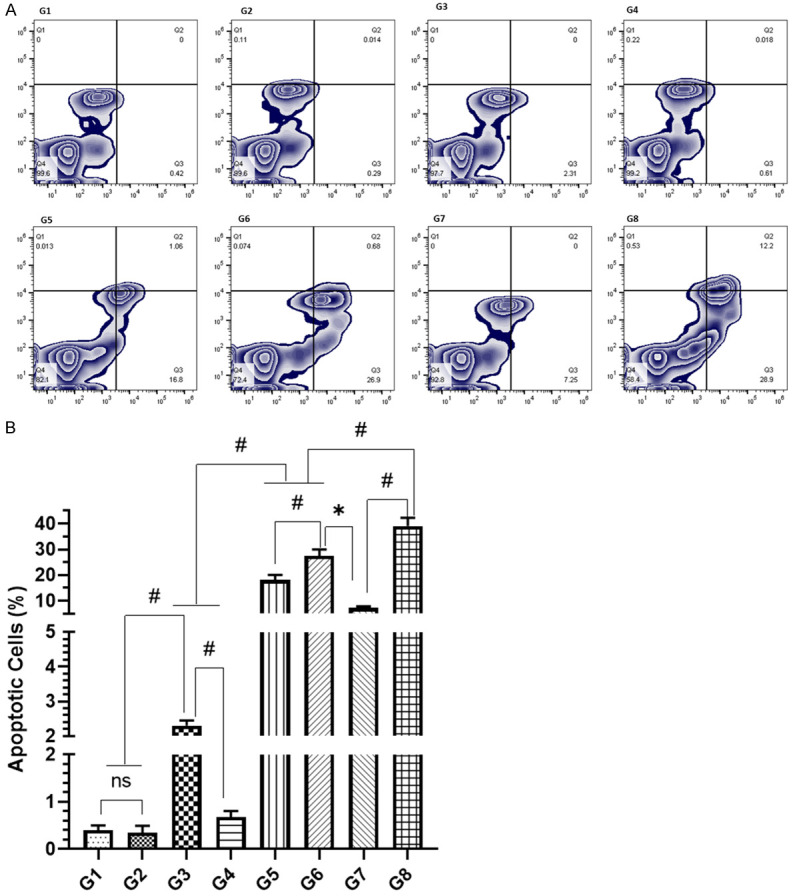
Figure 7.

Effect of various formulations on induction of apoptosis by flow cytometry analysis (A) representative images of flowjo analysis of the cells (B) Detailed analysis of apoptotic cells. The values are expressed as mean ± SD of 5 mice from each group. NS No significance within the groups, *Significant difference between the treated groups but in reverse order, #Significant difference between the treated groups.
