
Fig. 1.
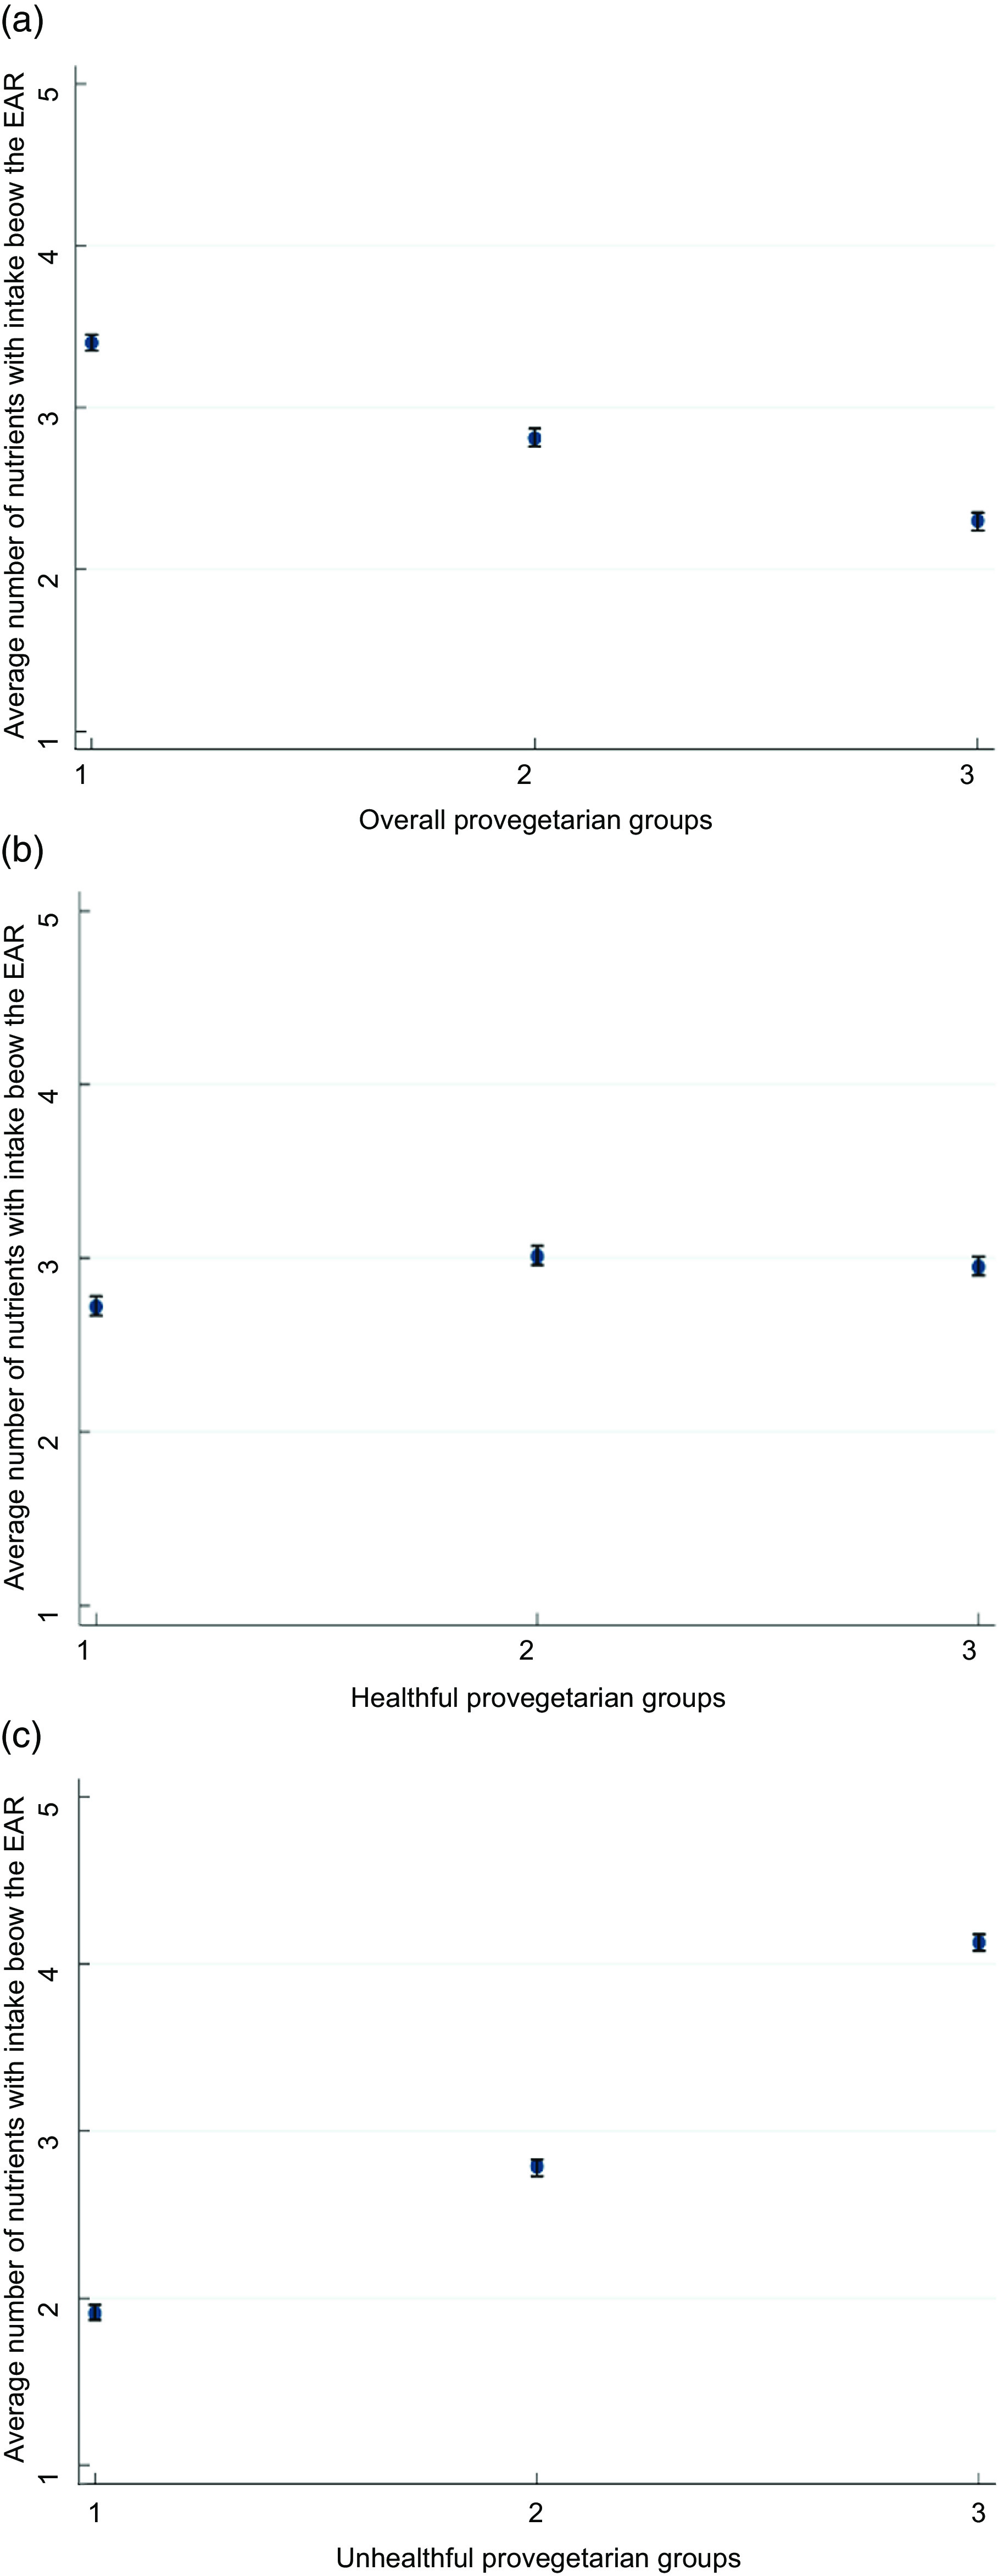
(a) Average number and 95 % CI of micronutrients with intakes below the EAR according to groups of the overall provegetarian FP. Adjusted for sex and age. (b) Average number and 95 % CI of micronutrients with intakes below the EAR according to groups of the healthful provegetarian FP. Adjusted for sex and age. (c) Average number and 95 % CI of micronutrients with intakes below the EAR according to groups of the unhealthful provegetarian FP. Adjusted for sex and age. EAR, estimated average requirement; FP, food pattern