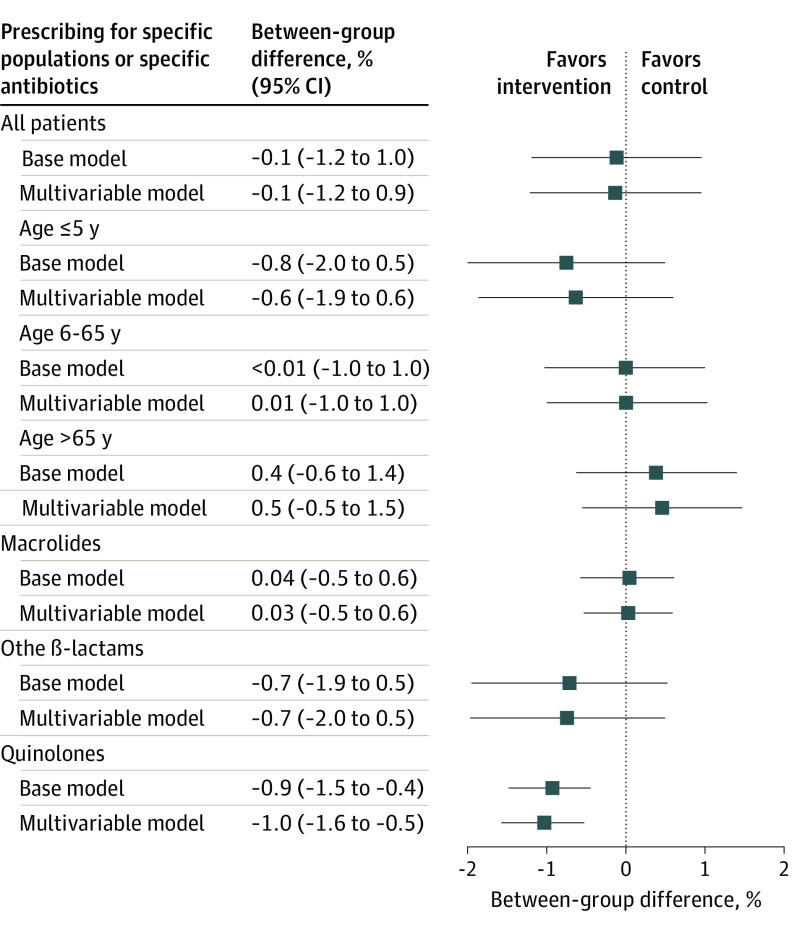
Figure 3. Change in Prescription Rates per 100 Consultations by Physicians in the Intervention vs the Control Group in the Second Year of the Intervention (Intention-to-Treat Analysis) Relative to the Baseline Year 2017.
The base model is treatment variable adjusted to baseline prescription rate and the multivariable model is adjusted to the predefined comorbidities.

