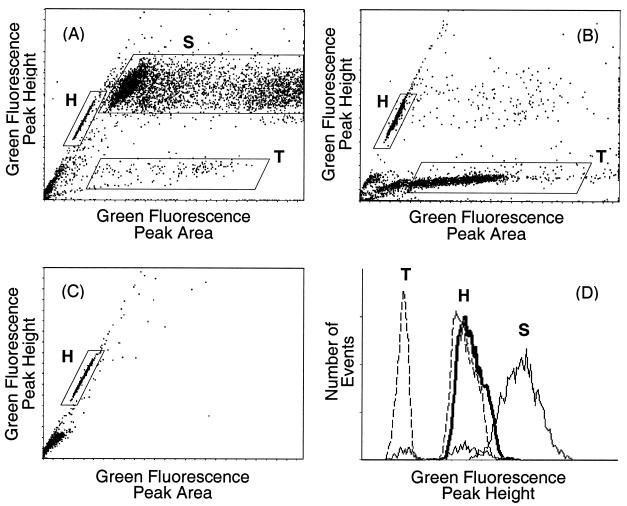
FIG. 2.
Bivariate histograms of green fluorescence peak height versus peak area for acid-denatured, AO-stained preparations from wild-type mice. Regions containing intact sperm (S), free sperm heads (H), and free sperm tails (T) are marked. (A) Intact sperm. (B) Trypsin-treated sperm. (C) Sonicated sperm. (D) Histograms of green fluorescence peak height for the indicated gated areas from intact sperm (thin solid lines), trypsin-treated sperm (dashed lines), and sonicated sperm (thick solid line).

