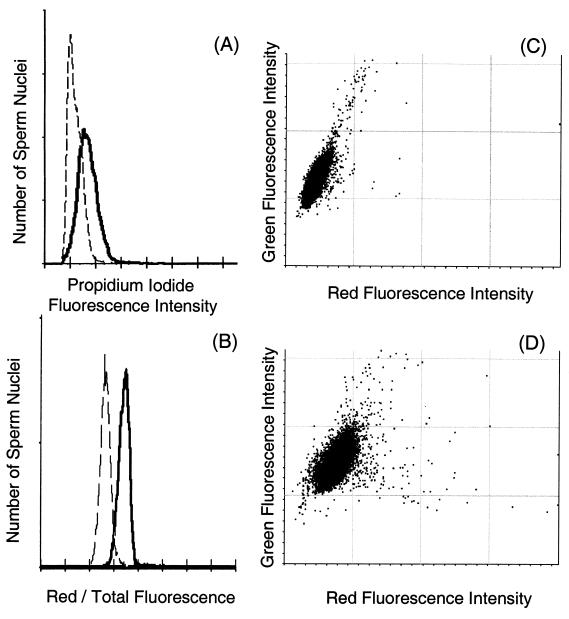
FIG. 8.
Flow cytometric analysis of sperm chromatin defects. (A) Distributions of propidium iodide fluorescence intensities for sperm heads prepared by sonication from Tnp2-null mice (solid line) and from wild-type mice (dashed line). (B) Distributions of the relative amount of red fluorescence (red/total fluorescence) of acid-denatured, AO-stained sperm heads prepared with trypsin from Tnp2-null mice (solid line) and from wild-type mice (dashed line). (C and D) Bivariate histograms of green versus red fluorescence for acid-denatured, AO-stained sperm heads prepared by sonication from wild-type (C) and Tnp2-null (D) mice.

