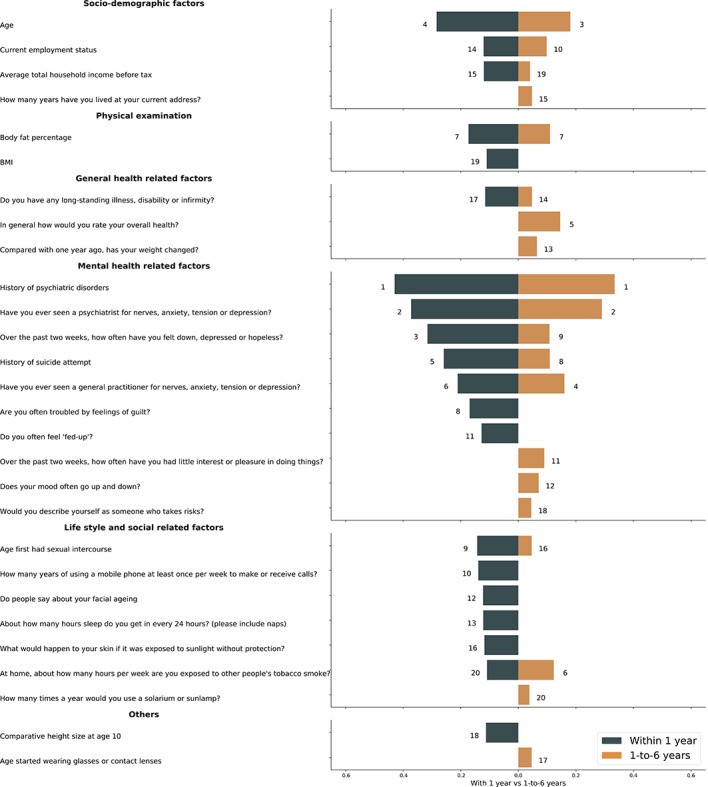
Figure 3.

The comparison of top 20 features identified in suicide risk prediction full models for within 1 year and 1-to-6 years. The dark blue and yellow bar represent the relatively importance of these input features for the prediction, respectively. And the numbers next to the bars are corresponding to the ranking of top 20 features. The detailed information of the included features is shown in Table S2 in Multimedia Appendix 1.
