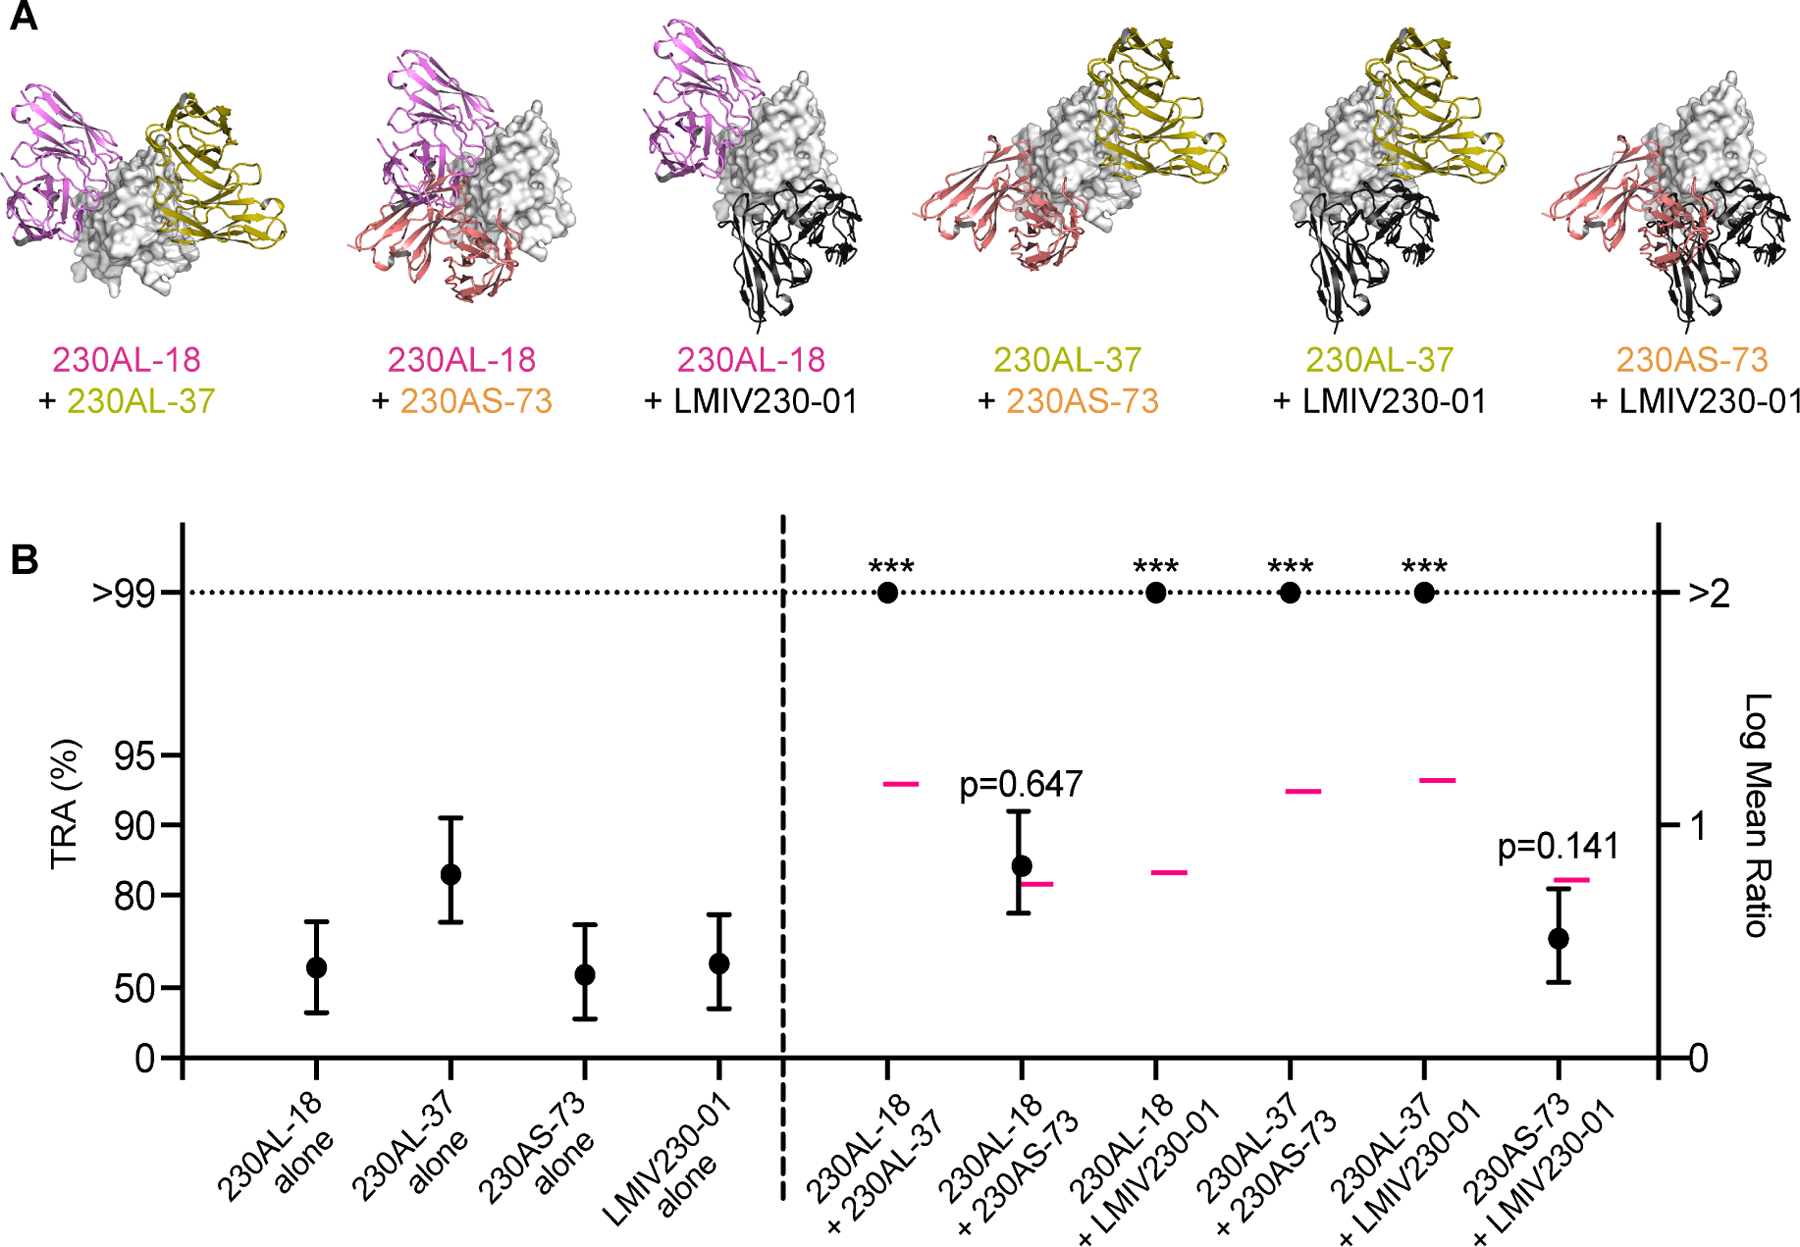
Figure 5. Pfs230D1 hmAbs display a synergistic effect in SMFA.

(A) Cartoons depicted the binding epitopes of six paired combinations among four hmAbs (ribbons) on Pfs230D1 (gray surface). (B) Four hmAbs were tested at 5 μg/ml either alone or in combinations of two hmAbs. The best estimated % TRA (black filled circles) and the 95% confidence interval (error bars) from three independent assays are shown. The theoretical additive values calculated using the Bliss independence model are shown in pink bars (–). Asterisks indicate that the mixture group showed significantly higher %TRA than the theoretical additive inhibition (*** p< 0.001). The ratio of mean oocyst numbers is plotted on a log scale (Log Mean Ratio, right side of y-axis), and the associated TRA (%) values are shown on the left side of the y-axis.
