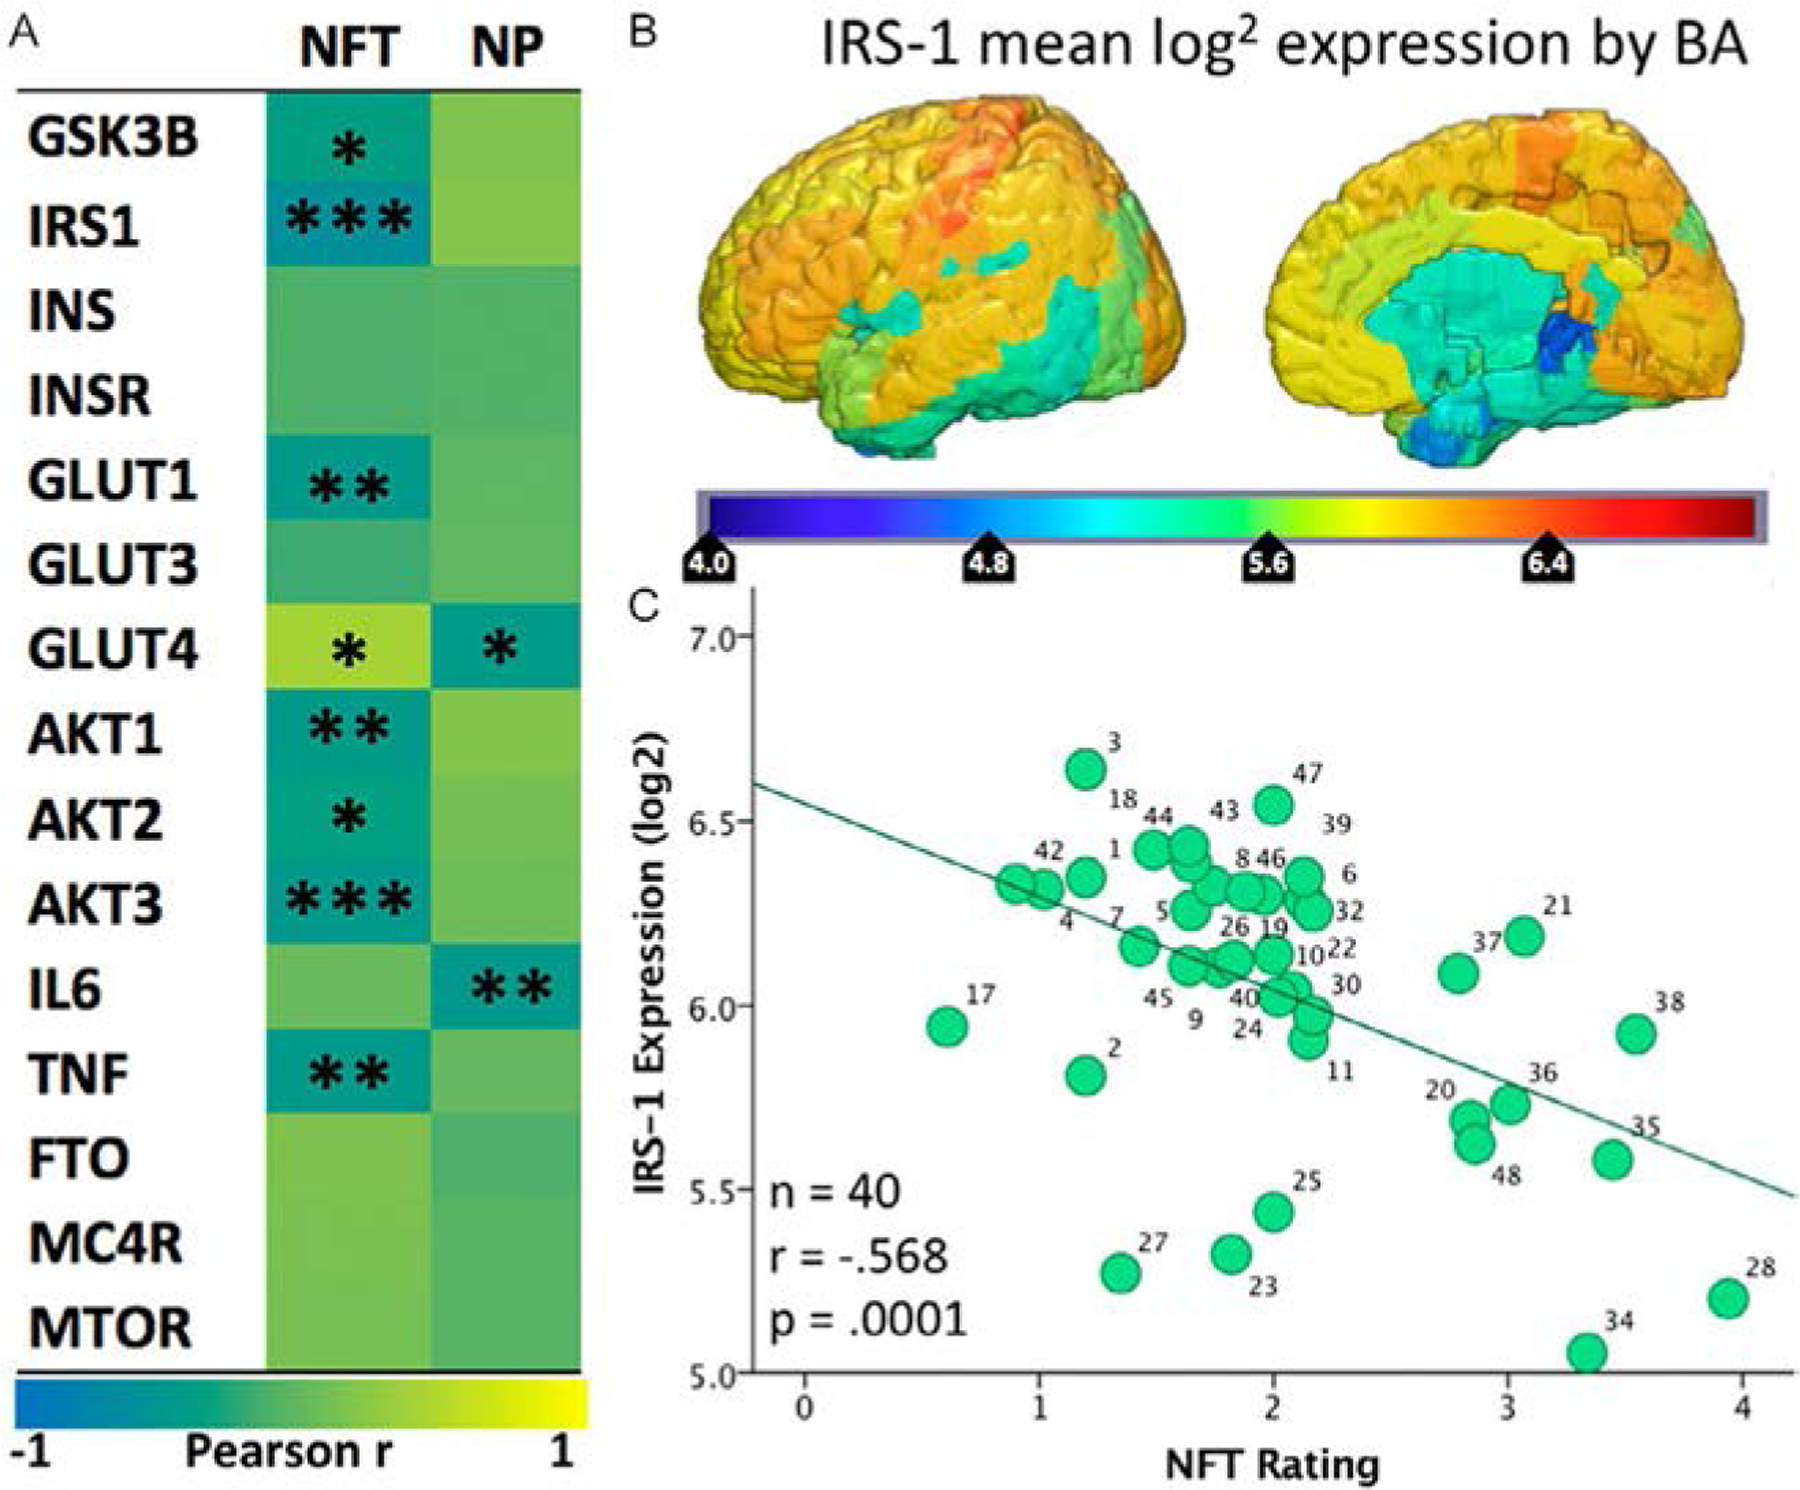
Fig. 2.

(A) Heatmap (“jet”: red high, blue low) of the spatial correlation between levels of expression of various genes from the Allen Human Brain Atlas and the density of NFTs or NPs in AD brains reported by Arnold et al. (1991). Asterisks (*/**/***) represent P values of <0.05/0.01/0.001, respectively. (B) Map of mean IRS-1 log2 expression in the six healthy human specimens included in the Allen Human Brain Atlas. (C) Scatter plot of the mean IRS-1 log2 expression from the Allen Human Brain Atlas and NFT density reported by Arnold et al. (1991). Each of the 40 data points corresponds to a Brodmann Area for which both gene expression levels and tangle density ratings were available. Previously published in Mullins et al. (2017a).
