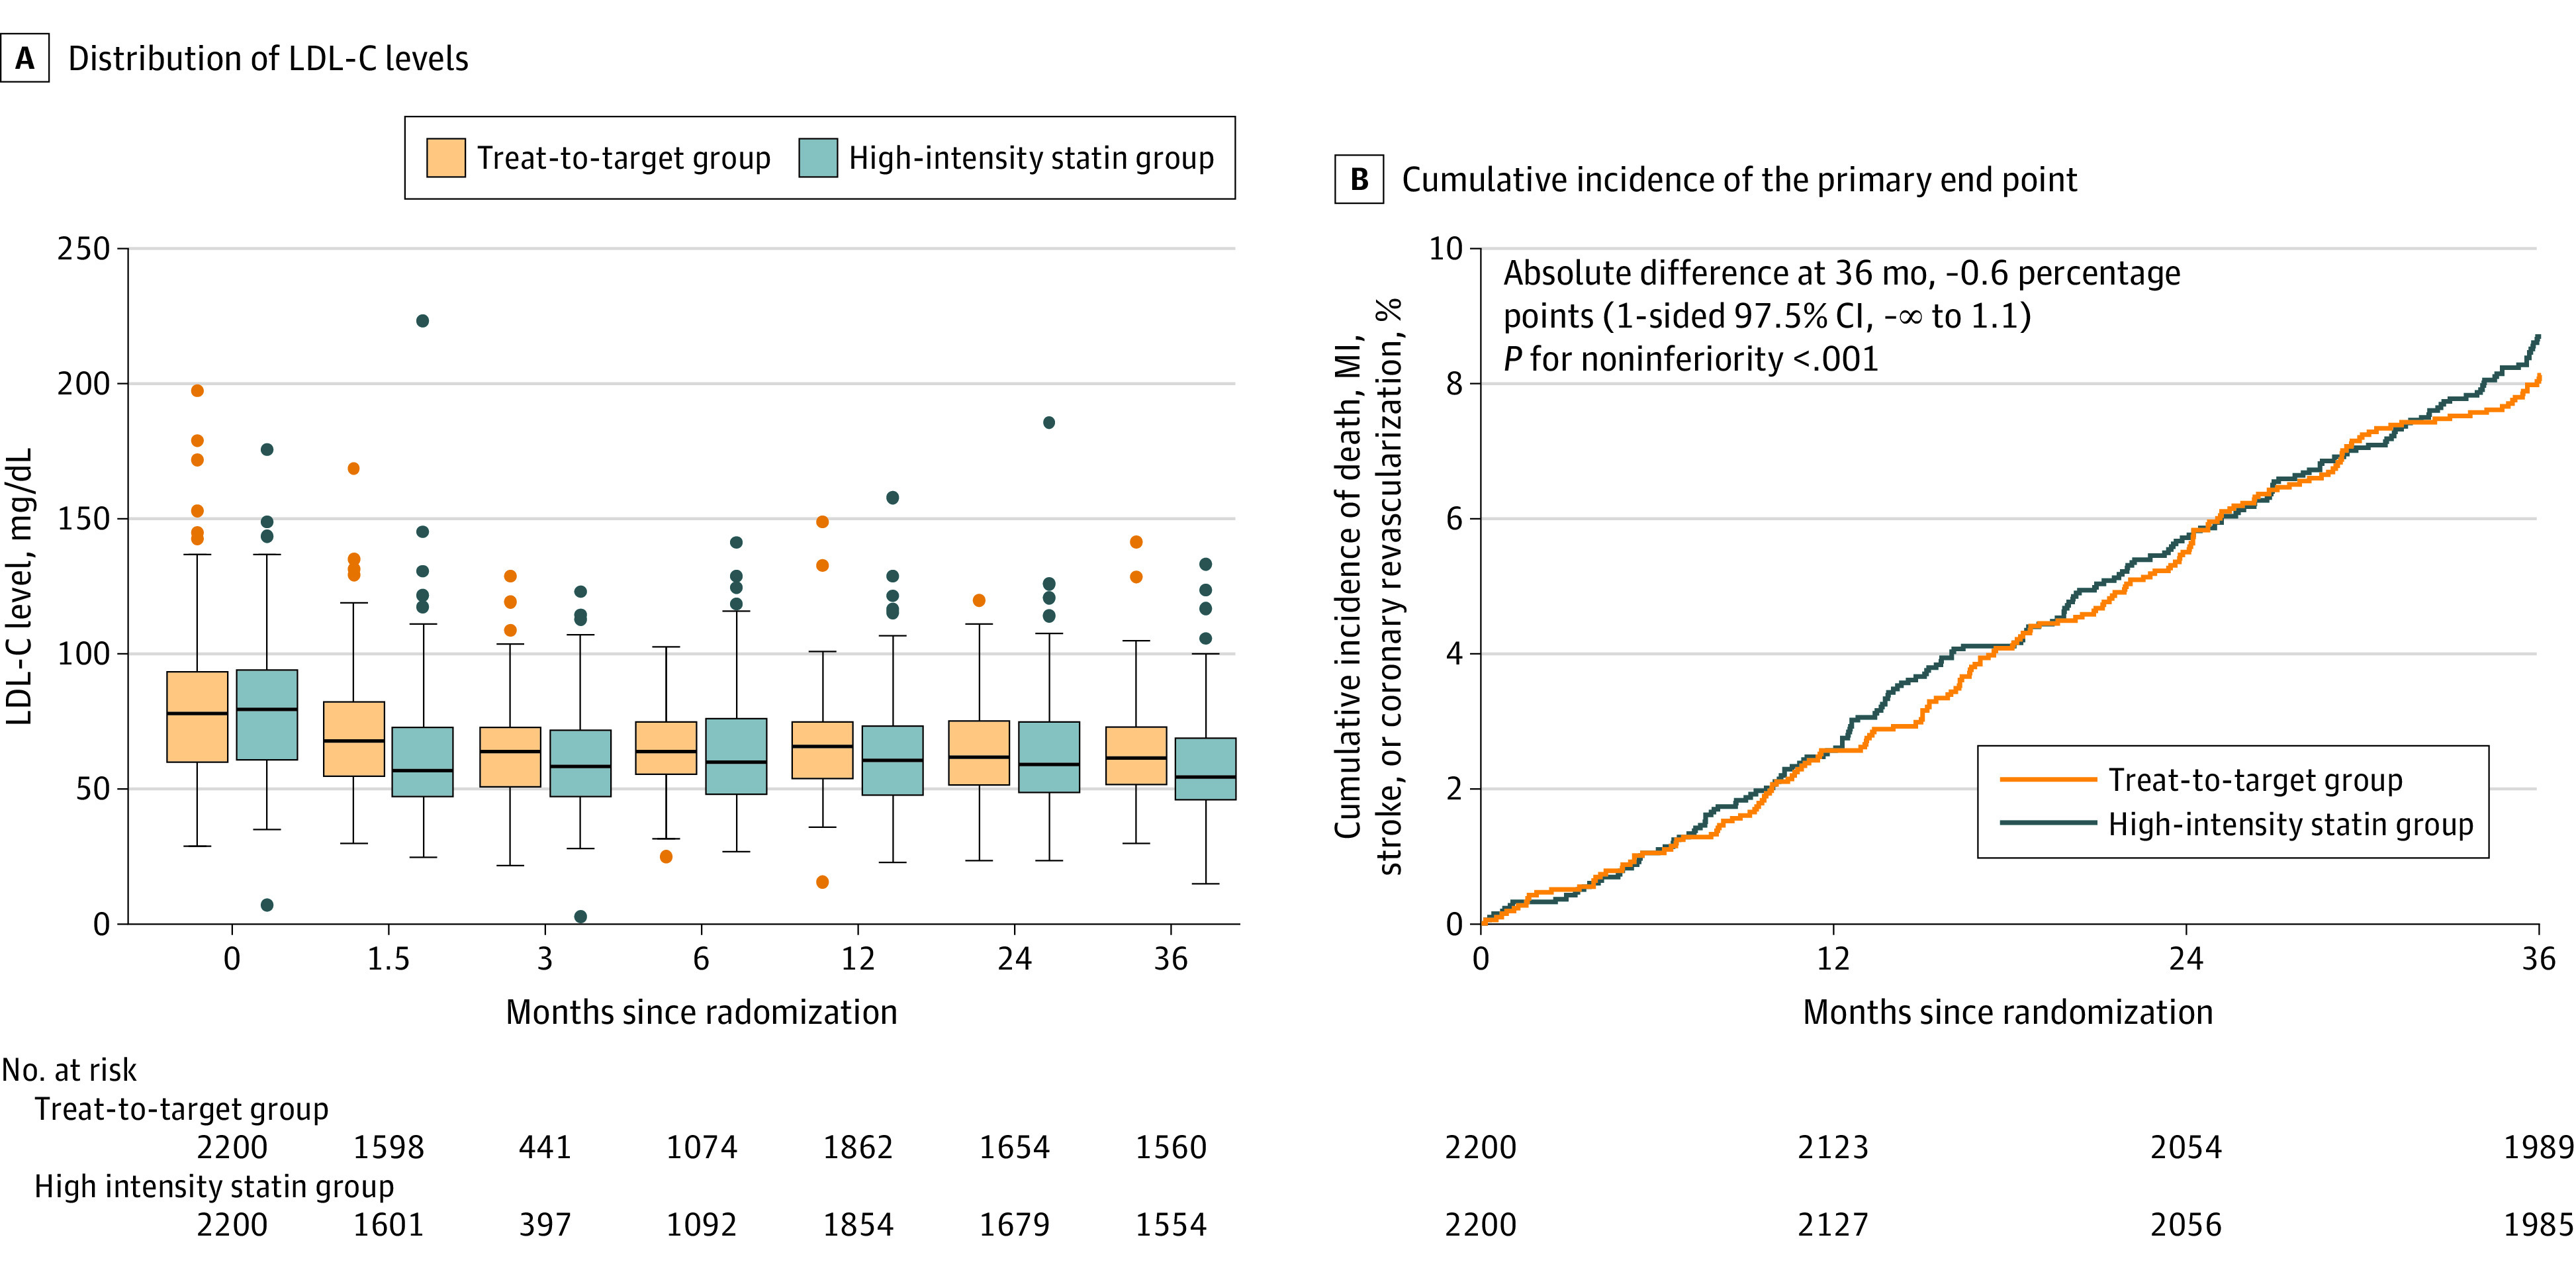
Figure 3. Changes in LDL-C Levels and Kaplan-Meier Curves for the Primary End Pointa.

In panel A, the middle lines in the box plots represent the median values, boxes represent the IQRs, whiskers extend to the most extreme observed values with 1.5 × the IQR of the nearer quartile, and dots represent observed values outside that range. Reference values may vary based on laboratory and location. LDL-C indicates low-density lipoprotein cholesterol; MI, myocardial infarction.
aChanges in total cholesterol, triglyceride, and high-density lipoprotein cholesterol levels over time are also presented in eFigure 1 in Supplement 2.
