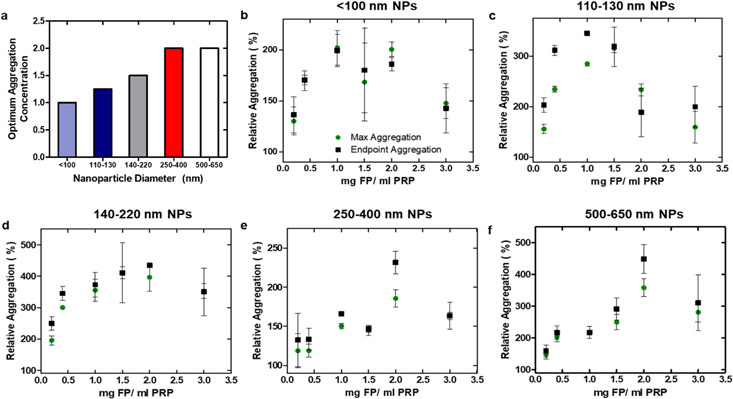
Figure 3. Particle size and concentration modulate platelet aggregation.
Absorbance measurements of PRP and particle combinations were taken on a microplate reader and converted to transmission, where the increase in transmission reflects the generation of platelet aggregation. (a) Concentrations at which optimum aggregation was observed. If maximum and endpoint averages reached their respective maxima at two consecutive concentrations, an average between the two concentration was reported. (b) – (f) Maximum and endpoint aggregation of the five nanoparticle size groups, normalized to the positive control (PRP + ADP). This experiment was conducted on a single batch of plasma.

