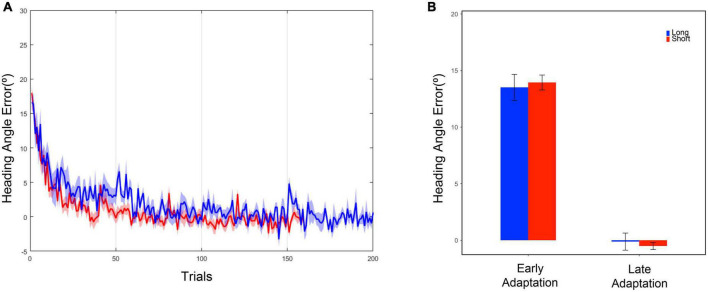
FIGURE 3.
(A) Heading angle error curve. The blue line represents the mean, and the blue shadow represents the standard error of the mean of the long task group. The red line represents the mean, and the red shadow represents the standard error of the mean of the short task group. (B) Heading angle error in the early and late adaptation period. Each bar represents the mean of heading angle error, and the error bar represents the standard error of mean. The early adaptation period represents the first five trials of the adaptation phase, and the late adaptation period represents the last five trials of the adaptation phase.

