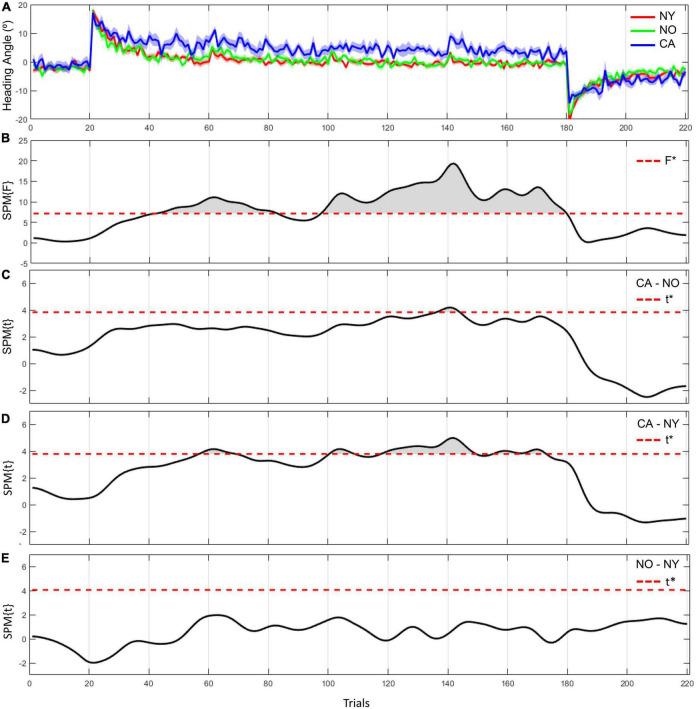
FIGURE 4.
The heading angle error between the three groups and the results of statistical inference. (A) The red line and its shaded area represent the averaged heading angle error and standard error of mean in NY group. The green and blue lines and shaded areas represent the same in NO and CA groups, respectively. (B–E) F-scores in one-way ANOVA and t-scores in two-sample t-test as a post hoc paired comparison. F star (*) and t star (*) represent a significance threshold in each analysis.

