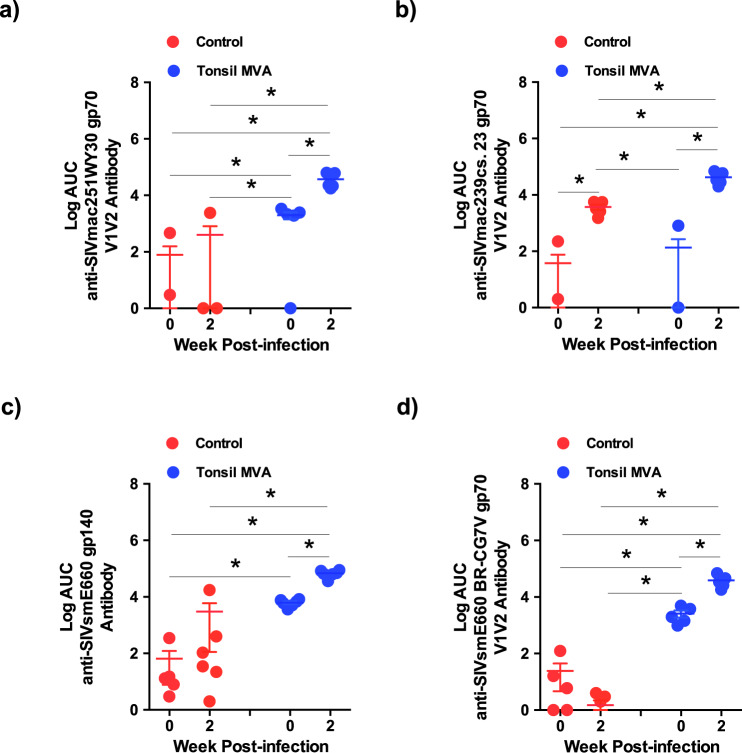
Fig. 4. Tonsil vaccination induced significant levels of V1V2 specific antibodies against homologous and heterologous strains of SIV.
(a) SIVmac251-WY30 gp70 V1V2 antibody (week 0 control vs week 2 control P = ns; week 0 control vs week 0 tonsil MVA P = 0.0087; week 2 control vs week 0 tonsil MVA P = 0.0216; week 2 control vs week 2 tonsil MVA P = 0.0022; week 0 tonsil MVA vs week 2 tonsil MVA P = 0.0040). (b) SIVmac239-cs.23 gp70 (week 0 control vs week 2 control P = 0.0022; week 0 control vs week 0 tonsil MVA P = ns; week 2 control vs week 0 tonsil MVA P = 0.0022; week 2 control vs week 2 tonsil MVA P = 0.0040; week 0 tonsil MVA vs week 2 tonsil MVA P = 0.0022). (c) SIVsmE660-gp140 (week 0 control vs week 2 control P = ns; week 0 control vs week 0 tonsil MVA P = 0.0011; week 2 control vs week 0 tonsil MVA P = 0.0325; week 2 control vs week 2 tonsil MVA P = 0.0011; week 0 tonsil MVA vs week 2 tonsil MVA P = 0.0011), and (d) SIVsmE660-BR-CG7V gp70 (week 0 control vs week 2 control P = ns; week 0 control vs week 0 tonsil MVA P = 0.0022; week 2 control vs week 0 tonsil MVA P = 0.0022; week 2 control vs week 2 tonsil MVA P = 0.0022; week 0 tonsil MVA vs week 2 tonsil MVA P = 0.0040). specific antibody responses in control (n = 6) and tonsil vaccinated (n = 6) animals at 0 and 2 weeks post infection. Data are presented as mean values + /– standard error. Statistical analysis was performed using one-tailed Mann–Whitney U test and a P < 0.05 (*) was considered significant. * indicate P < 0.05. Error bars represent standard error.

