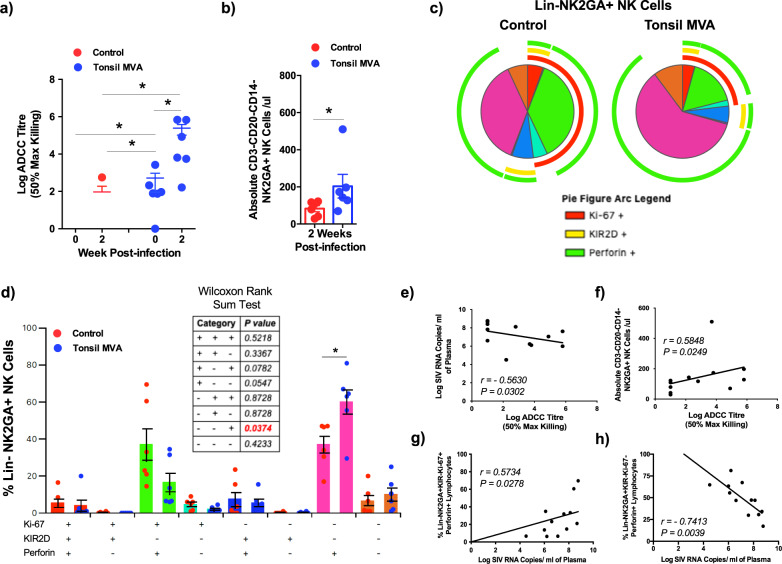
Fig. 5. Tonsil vaccination induced high levels of ADCC and NK cell responses that inversely correlated with acute plasma viremia.
(a) Log ADCC titre (50% max killing) in control (n = 6) and tonsil vaccinated (n = 6) animals at 0 and 2 weeks post infection. Data are presented as mean values + /– standard error. Statistical analysis was performed using Mann–Whitney U test and a P < 0.05 (*) was considered significant. Error bars represent standard error. (b) Absolute numbers of NK cells in peripheral blood of control (n = 6) and tonsil vaccinated (n = 6) animals 2 weeks post infection (P = 0.0130). Data are presented as mean values + /– standard error. Statistical analysis was performed using One-tailed Mann–Whitney U test and a P < 0.05 (*) was considered significant. Error bars represent standard error. (c) Qualitative analysis of Ki-67, KIR2D and perforin expression in Lin−NKG2A+ NK cells in peripheral blood of control (n = 6) and tonsil vaccinated (n = 6) animals at 2 weeks post infection. (d) Frequency of Lin−NKG2A+ NK cells in peripheral blood of control (n = 6) and tonsil vaccinated (n = 6) animals that express Ki-67, KIR2D and perforin at 2 weeks post infection. Statistical analysis was performed using two-sided Wilcoxon rank sum test and a P < 0.05 (*) was considered significant. *indicate P < 0.05. Error bars represent standard error. Correlation between (e) plasma viral loads and log ADCC titre at 2 week post infection, (f) absolute numbers of NK cells and log ADCC titre, (g) frequency of LIN−NKG2A+KIR2D−Ki-67+Perforin+ NK cells and plasma viral loads at 2 weeks post infection, and (h) the frequency of LIN−NKG2A+KIR2D−Ki-67−Perforin+ NK cells and plasma viral loads at 2 weeks post infection in control (n = 6) and tonsil vaccinated (n = 6) animals. Correlations for (e–h) were determined using Spearman’s rank test and a P < 0.05 was considered significant.

