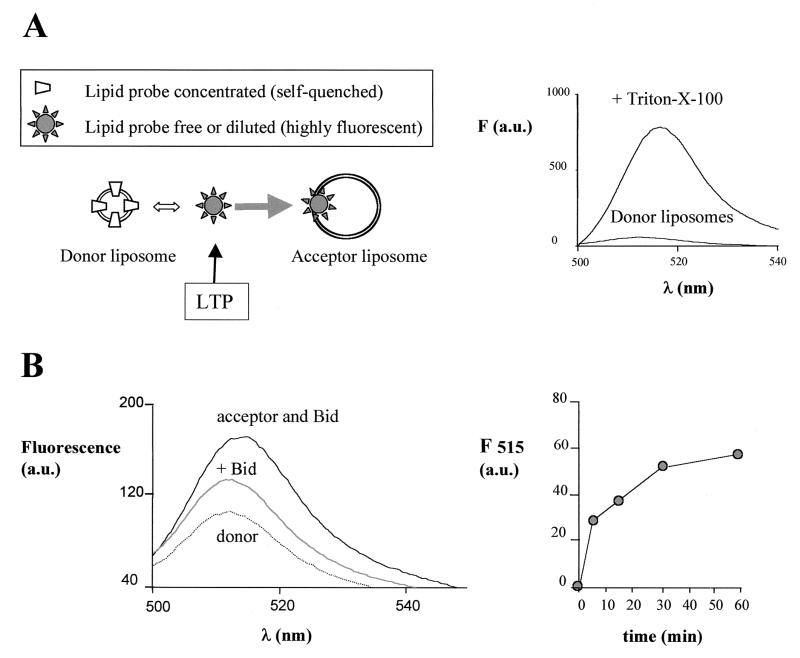
FIG. 2.
Bid displays lipid transfer activity with liposomes. (A) The scheme in the left panel illustrates the principles of the lipid transfer assay between donor and acceptor liposomes using fluorescent lipid probes (cf. references 2 and 27). The arrow indicates the action of an LTP, which fundamentally shifts the equilibrium dynamics of the whole process to the right. The right panel illustrates these principles experimentally. Donor liposomes containing 100 nM BODIPY FL C5-HPA show a quenched fluorescence due to the high molar fraction (see below) of the probe with respect to the other lipids in the membrane, but high fluorescence after solubilization and dilution of the probe with the detergent Triton X-100. (B) Lipid transfer activity was measured with a final concentration of 100 nM BODIPY FL C5-HPA under conditions equivalent to those in OM permeability and cell-free assays (see Materials and Methods). The donor liposomes were prepared by rapid injection of an ethanolic solution containing 1:3 (wt/wt) of the lipid probe with a mixture of purified phospholipids (44% PC, 31% PI, and 25% PS) in assay buffer. The acceptor liposomes were prepared by ethanol injection of a lipid mixture containing (wt/wt) 20% CL, 35% PC, 25% PI, and 18% PS and added at a final concentration of 3.5 μg/ml (i.e., 15-fold in excess of the concentration of donor liposomes). The results were obtained by recording time-resolved emission spectra with excitation at 485 nm. The dotted spectrum represents the fluorescence emission of donor liposomes alone, which was stable with time. Upon addition of native Bid isolated from mouse kidney (equivalent to a final concentration of approximately 10 nM Bid), a rapid increase of fluorescence occurred that stabilized to the middle spectrum shown. The subsequent addition of acceptor liposomes induced a large increase in fluorescence with time: the top spectrum was recorded after 15 min of incubation. The entire time course of the peak emission at 515 nm is shown in the right panel.

