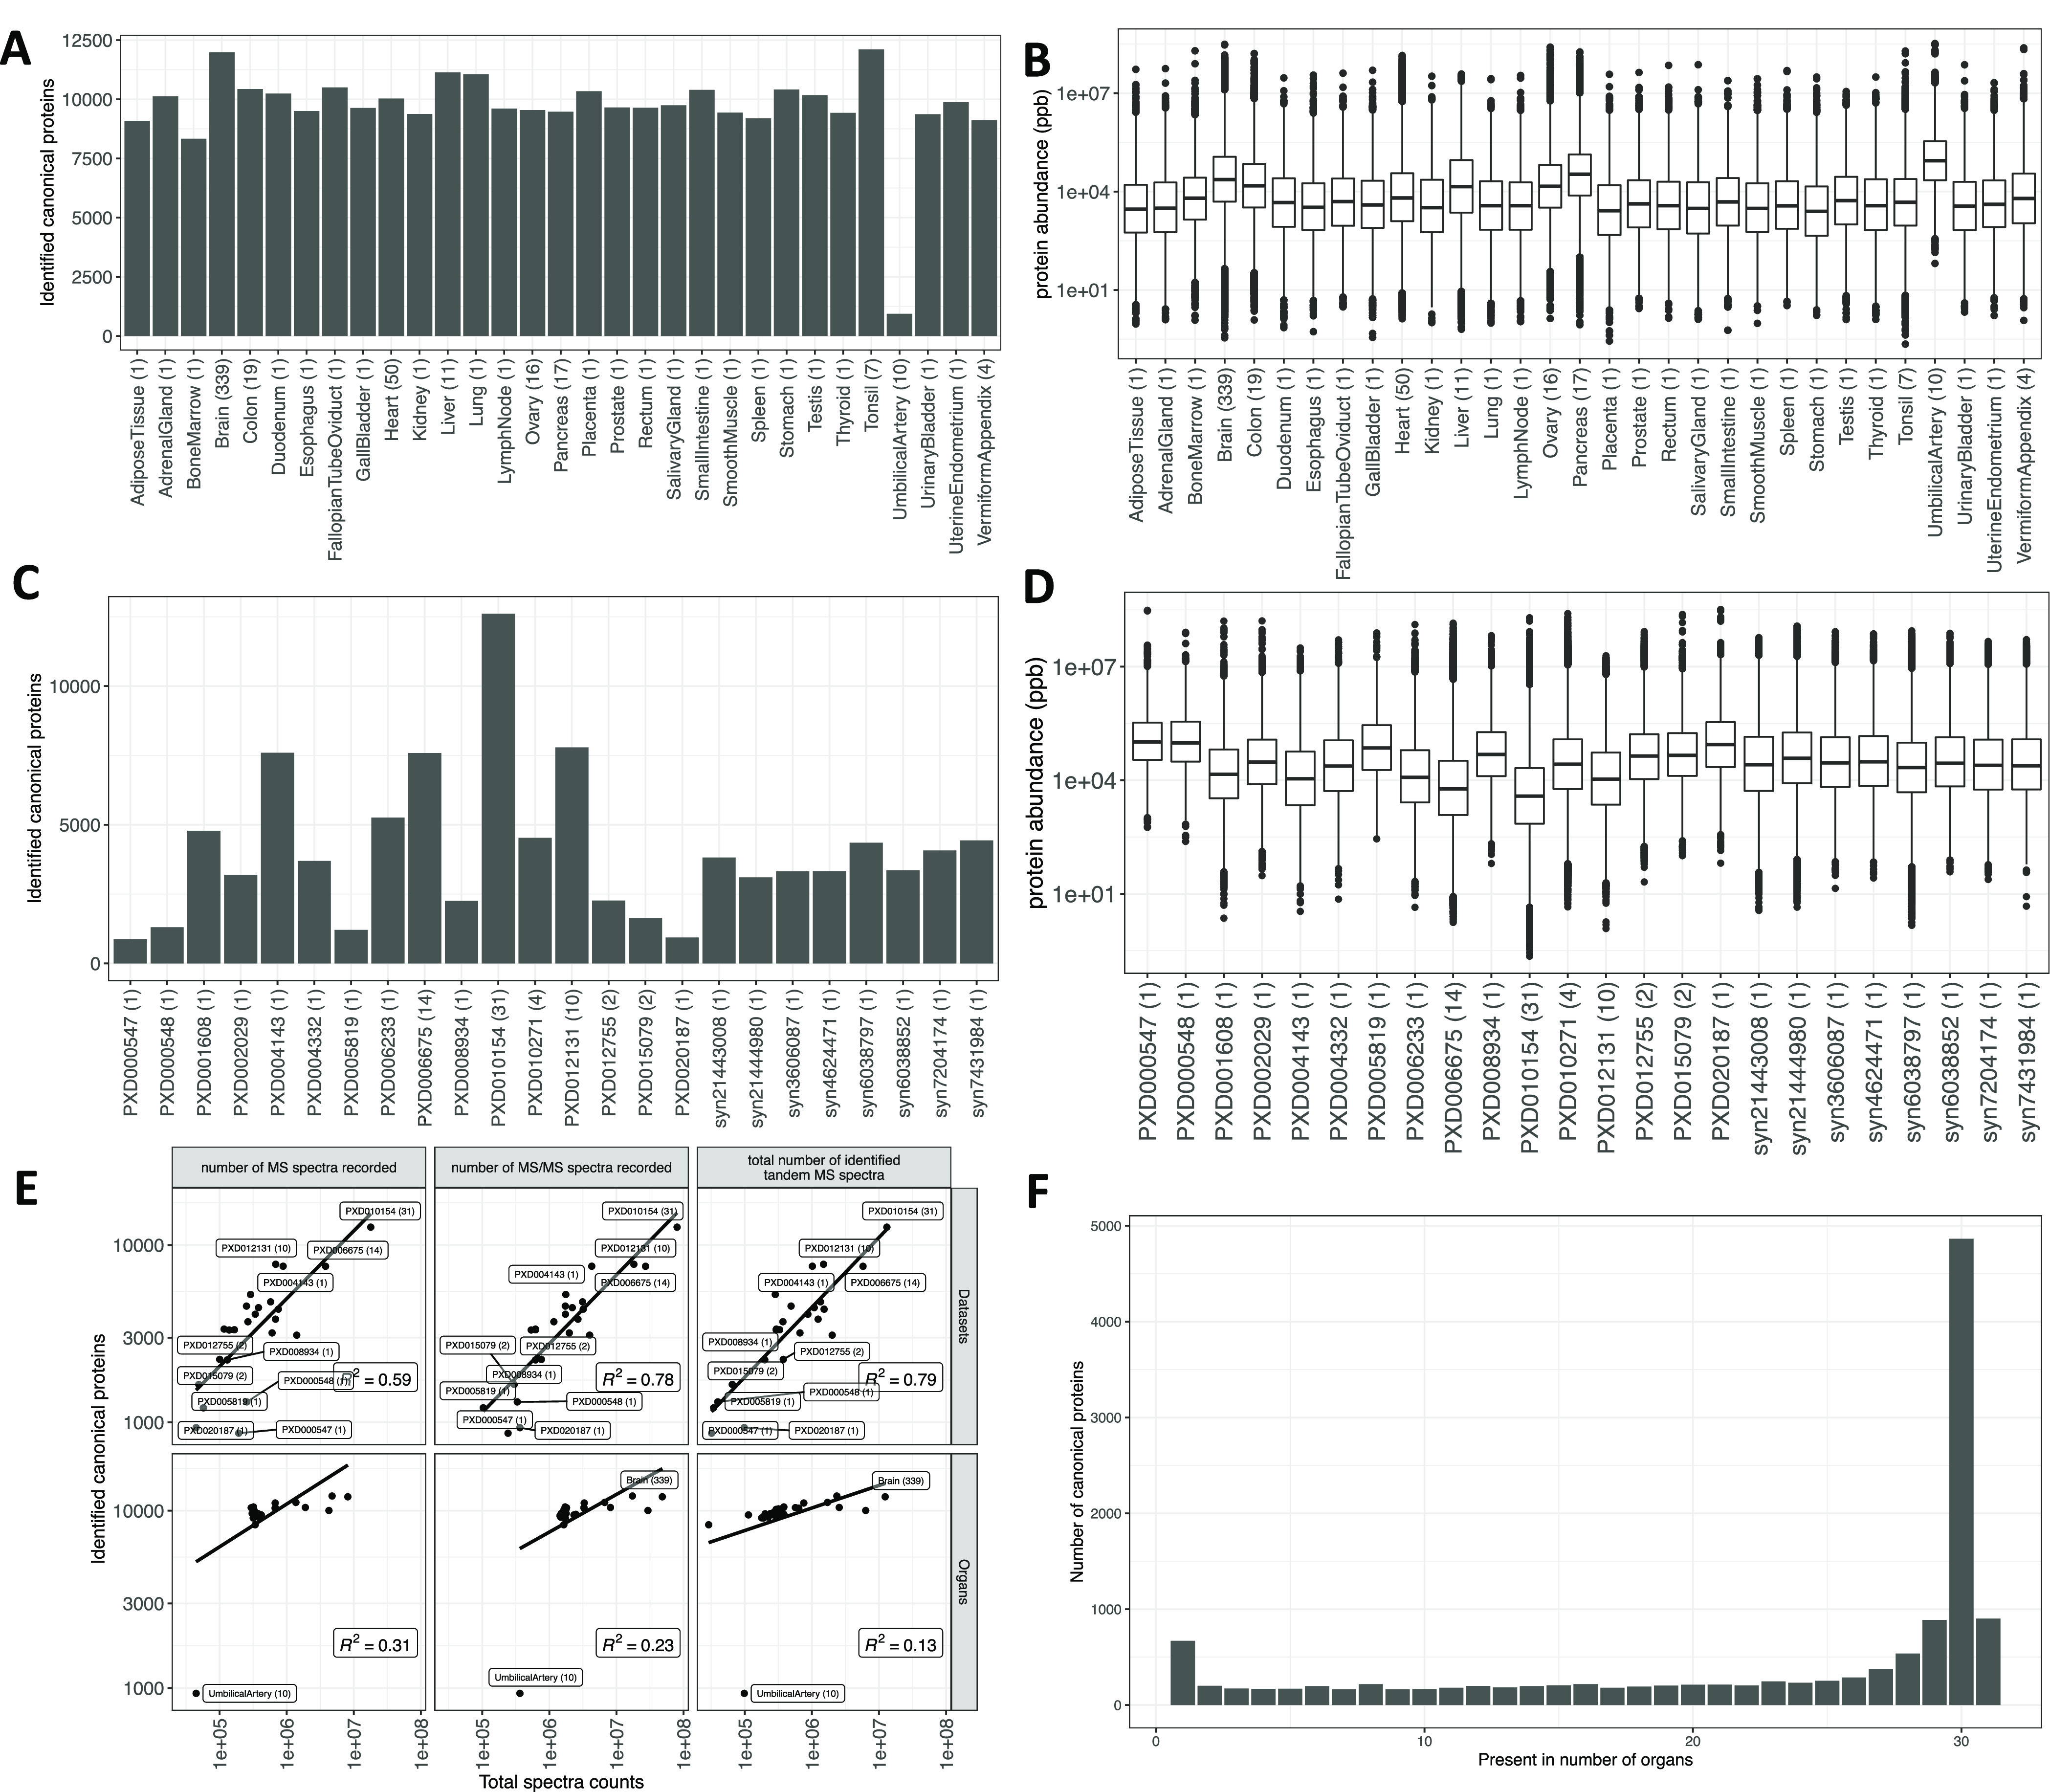
Figure 2.

(A) Number of canonical proteins identified across different organs. The number within the parenthesis indicates the number of samples. (B) Range of normalized iBAQ protein abundances across different organs. The number within the parenthesis indicates the number of samples. In panels (A) and (B), the term heart is used in a broader sense to mean the cardiovascular system. (C) Canonical proteins identified across different datasets. The number within the parenthesis indicates the number of unique tissues in the dataset. (D) Range of normalized iBAQ protein abundances across different datasets. The number within the parenthesis indicates the number of unique tissues in the dataset. (E) Comparison of total spectral data with the number of canonical proteins identified in each dataset and organ. (F) Distribution of canonical proteins identified across organs.
