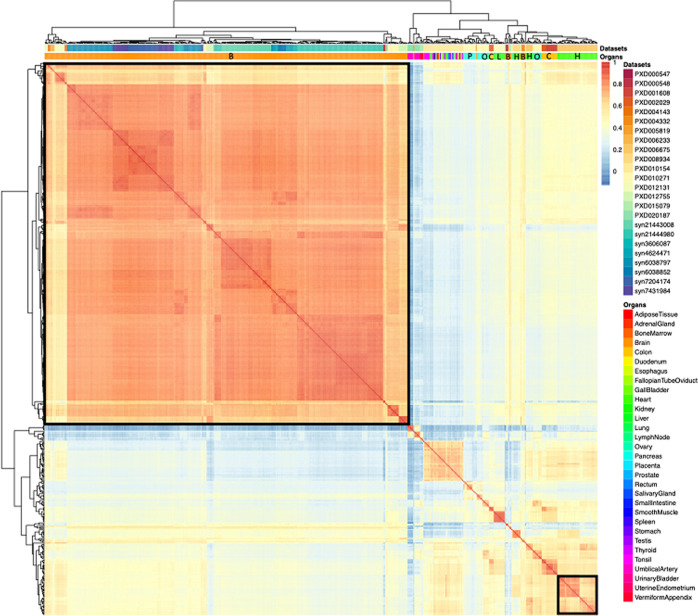
Figure 3.
Heatmap of pairwise Pearson correlation coefficients across all samples. The color on the heatmap represents the correlation coefficient, which was calculated using the bin-transformed iBAQ values. The samples are hierarchically clustered on columns and rows using Euclidean distances. The clusters composed of the brain and cardiovascular system (heart) samples are highlighted with black borders. The abbreviations used in the organs’ header are B: brain, C: colon, H: heart, L: liver, O: ovary, and P: pancreas.

