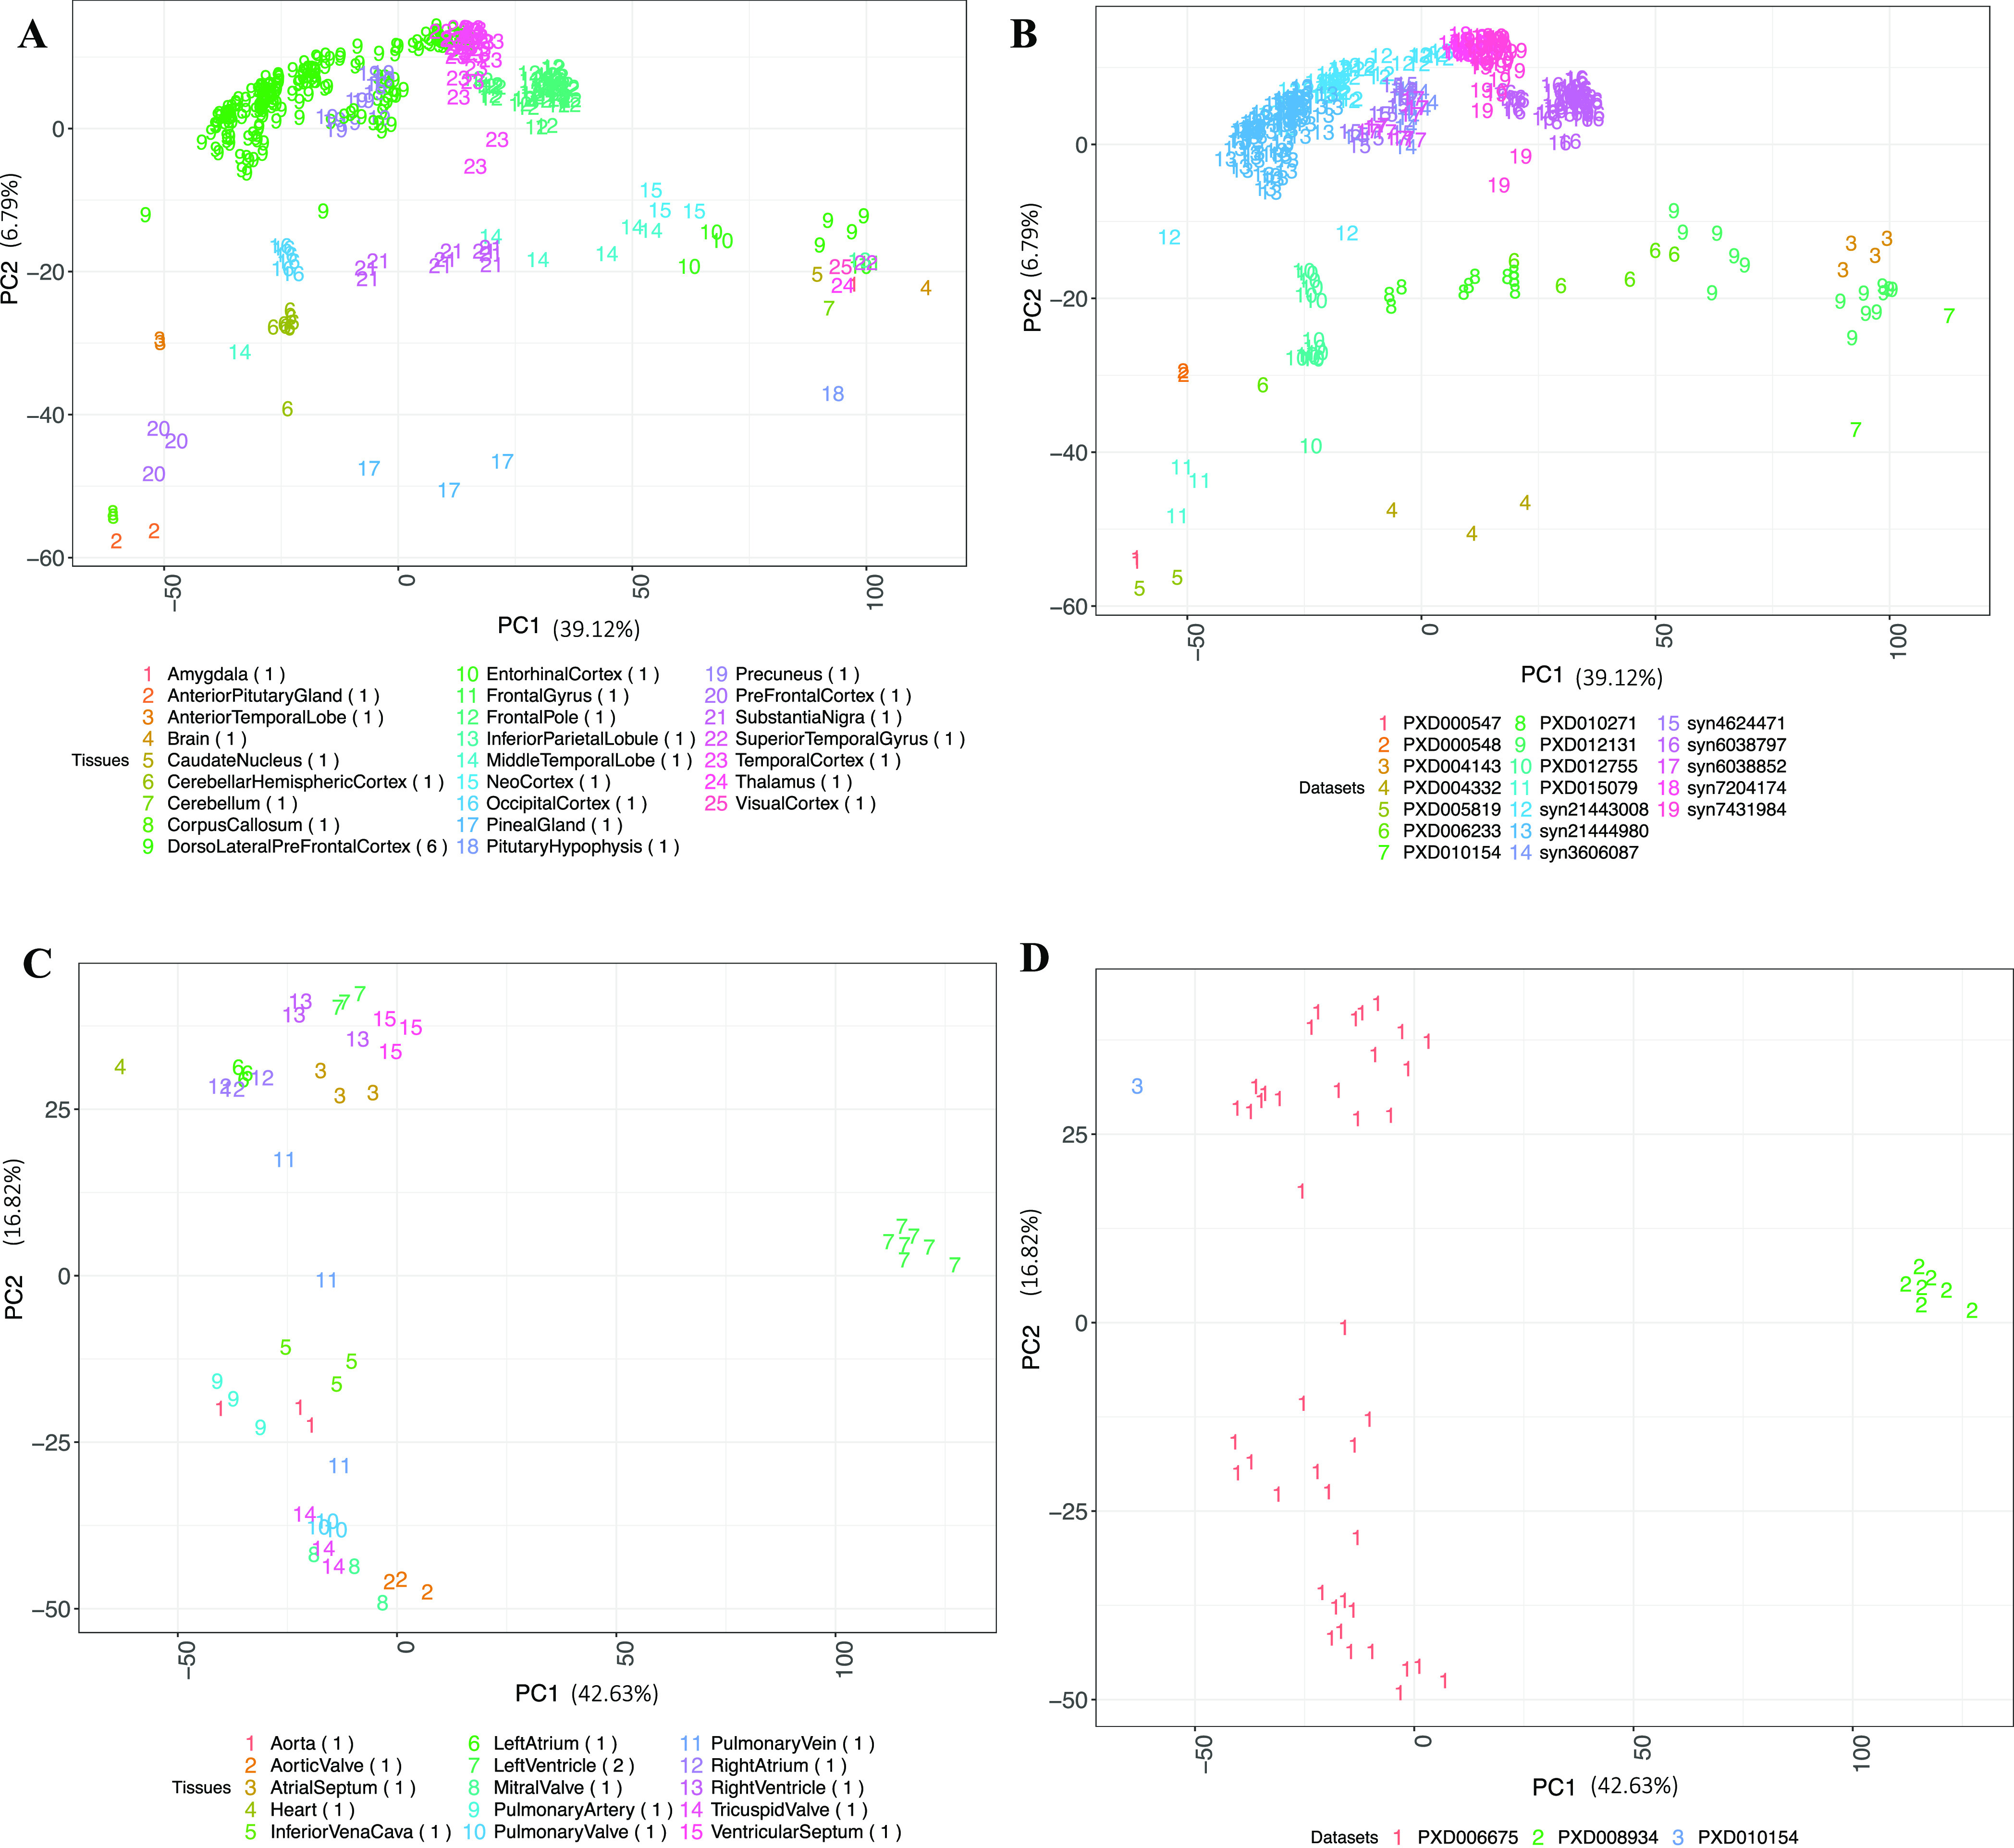
Figure 4.

(A) PCA of brain samples colored by the tissue types. (B) PCA of brain samples colored by their respective dataset identifiers. (C) PCA of cardiovascular system (heart) samples colored by the tissue types. (D) PCA of cardiovascular system (heart) samples colored by their respective dataset identifiers. The numbers in parenthesis indicate the number of datasets for each tissue. Binned values of canonical proteins quantified in at least 50% of the samples were used to perform the PCA.
