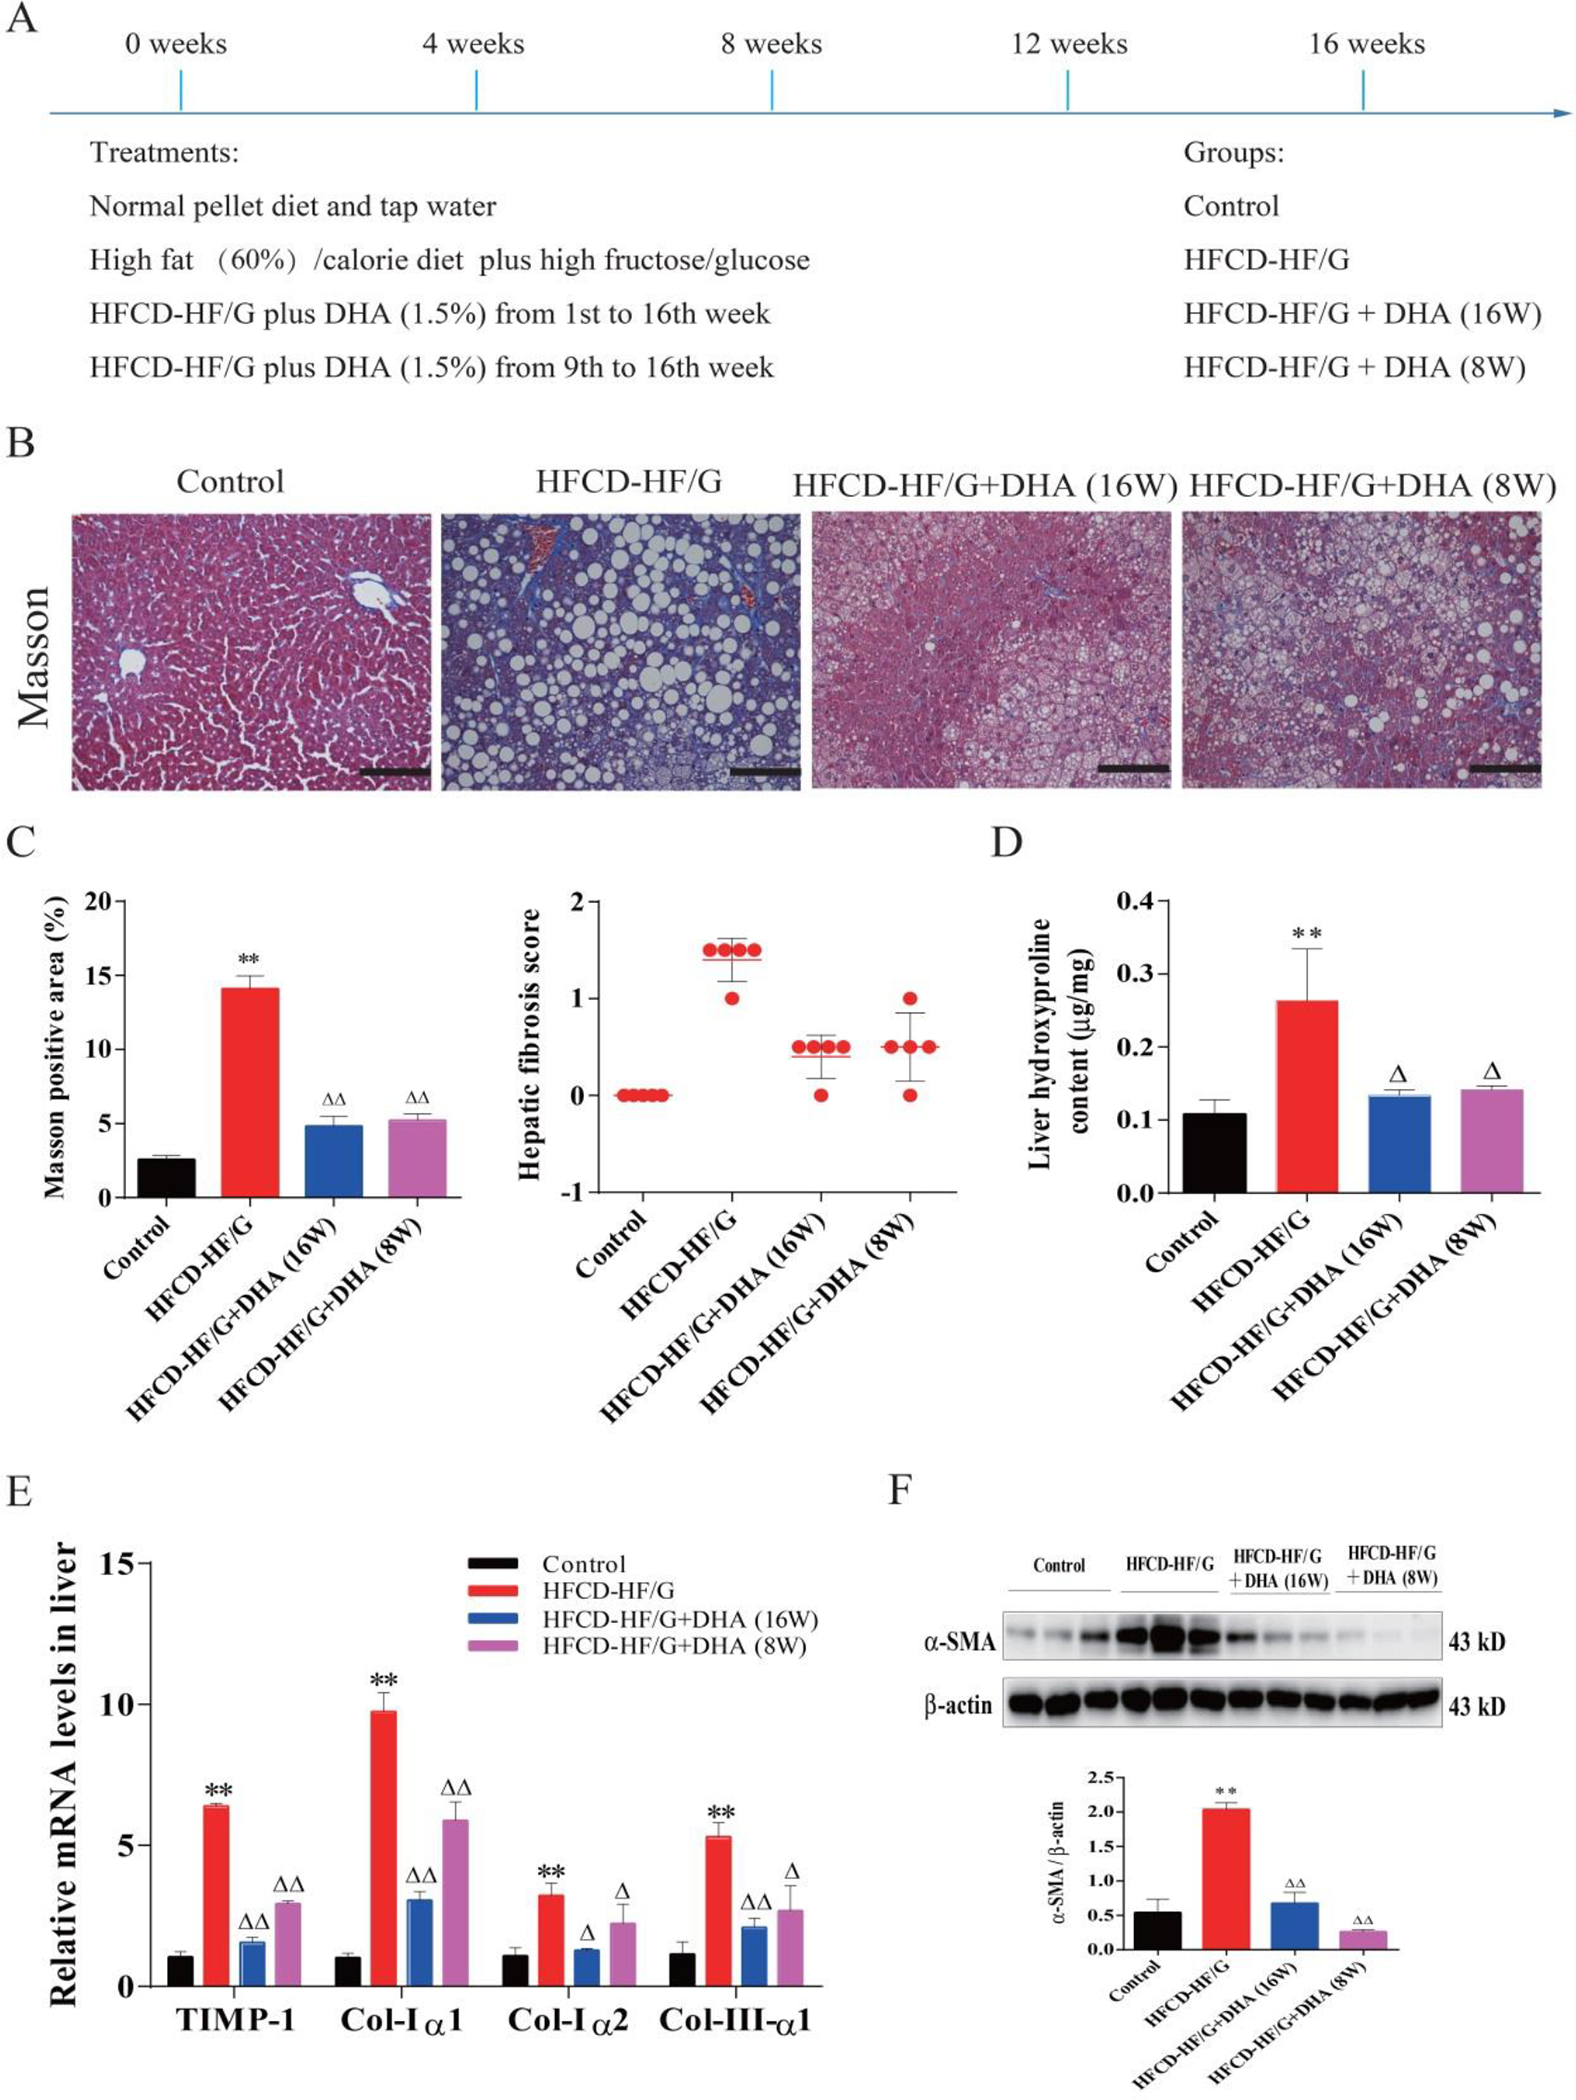
Fig. 1. Hepatic fibrogenesis in HFCD-HF/G-fed mice and effects of DHA on NASH-associated fibrosis.

A. Illustration of animal experimental design, treatment and time line of DHA supplementation. B. Representative micrographs of Masson Trichrome staining. Images were taken at original magnification (200×). Scale bars = 100 μm. C. Morphometrical quantitation of Masson staining positive area is shown on the left panel. Semiquantitative score of hepatic fibrosis by a pathologist is shown on the right panel. D. Liver hydroxyproline content (μg/mg tissue). E. mRNA levels of procollagen type-I (Col-Iα1, Col-Iα2), procollagen type-III (Col-IIIα1) and tissue inhibitor of metalloproteinase-1 (TIMP-1) in mouse liver. F. Western blot analysis of smooth muscle α-actin (α-SMA) protein levels. The densitometric ratio of α-SMA over β-actin is shown on the below. N=5 in each group, except Western Blots (N=3). All data were expressed as mean ± SEM. ** p < 0.01 compared to the controls. △, △△ p < 0.05 and 0.01 compared to HFCD-HF/G. The ANOVA variance test was used to compare between groups, and the LSD test was used for multiple comparisons between two given groups.
