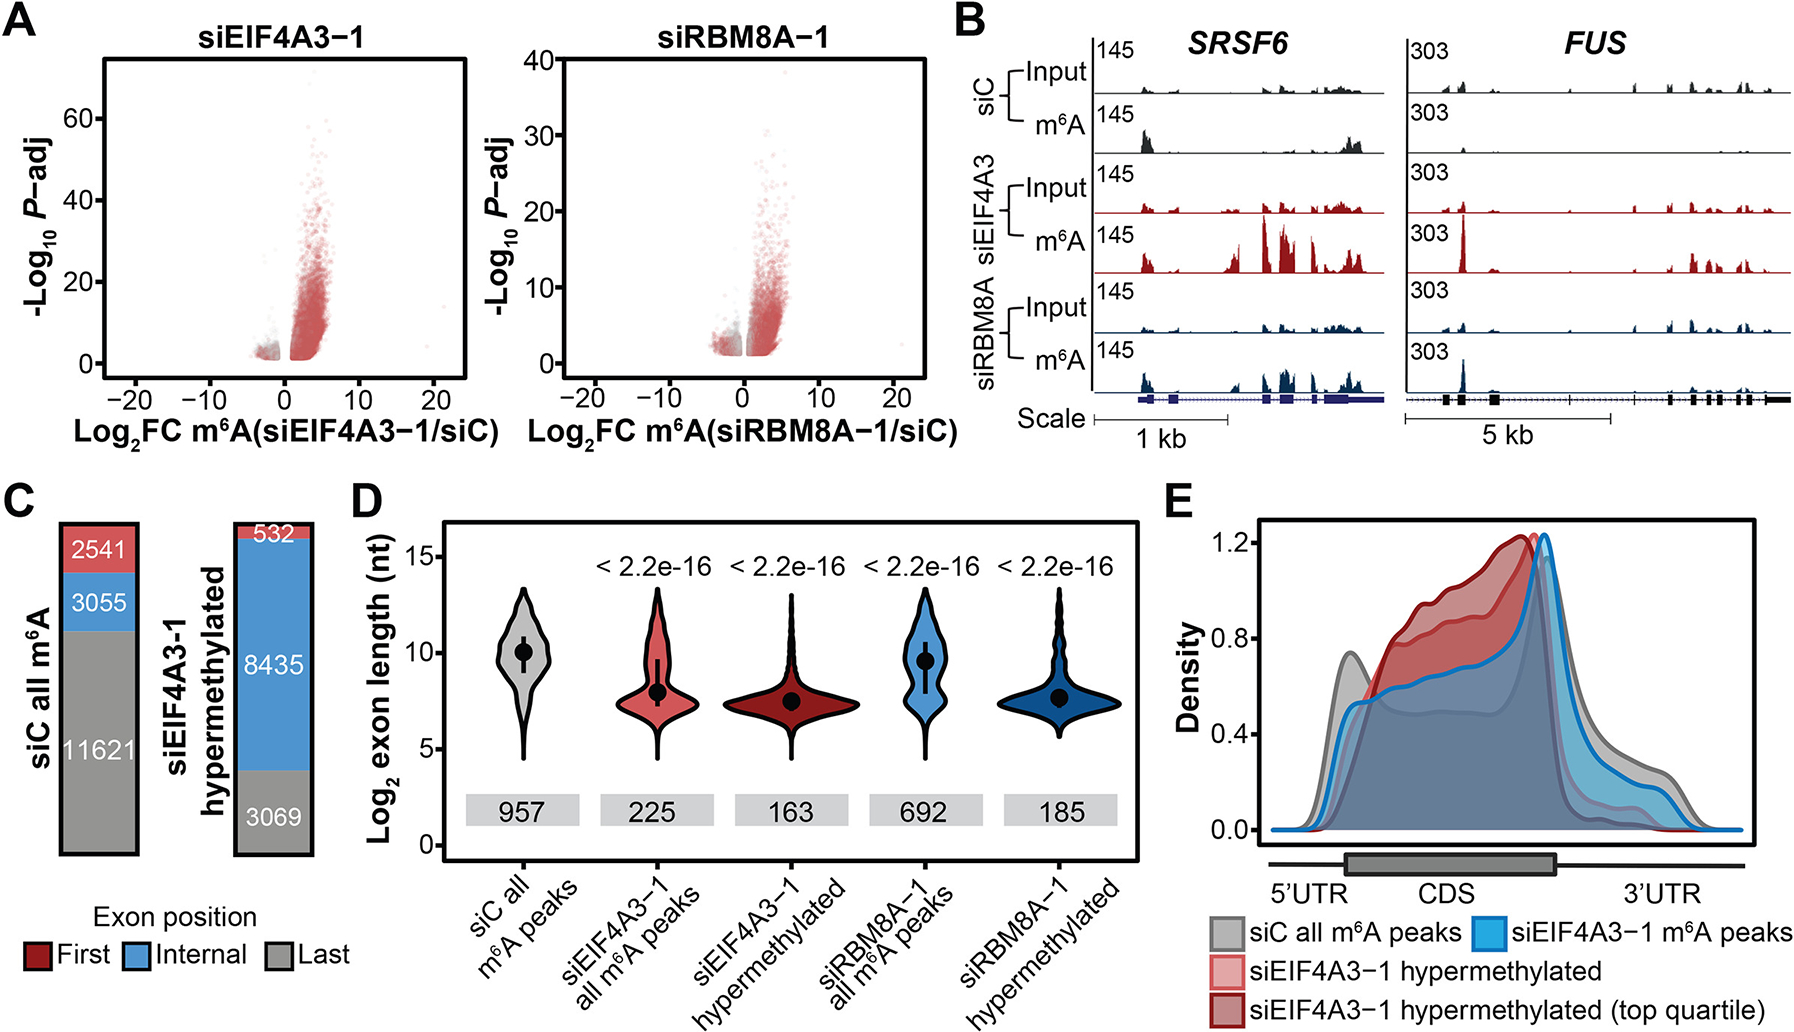
Fig. 3. EJCs protect exon junction-proximal RNA in average-length exons within CDS regions from m6A methylation.

(A) Differentially methylated regions upon EIF4A3 KD (left) and RBM8A KD (right) in HeLa cells (FDR<.1, |log2FC|>1). Three biological replicates. Gray and red dots indicate differentially methylated regions that overlap and do not overlap m6A peaks in the control cells, respectively. (B) Input and m6A-IP read coverage at FUS and SRSF6 in EIF4A3 KD, RBM8A KD, and control HeLa cells. (C) Numbers of EIF4A3 KD hypermethylated regions (left) and m6A peaks in control cells (right) that reside within first, internal or last exons (D) Exon lengths for m6A peaks residing within internal exons in control KD, EIF4A3 KD and RBM8A KD cells, and exon lengths of hypermethylated regions residing within internal exons in EIF4A3 and RBM8A KD cells. Dot and bar represent median and interquartile range, Wilcoxon rank sum test of indicated group vs. siC all m6A peaks. Sample size for each violin plot from left to right is: n = 3166, n = 6659, n = 8438, n = 3817, and n = 3827. (E) Metagenes of m6A peaks and significantly hypermethylated m6A regions (and top quartile) in EIF4A3 KD HeLa cells, and m6A peaks in control cells.
