
Fig. 4. mRNA m6A hypermethylation upon EJC depletion destabilizes mRNAs.
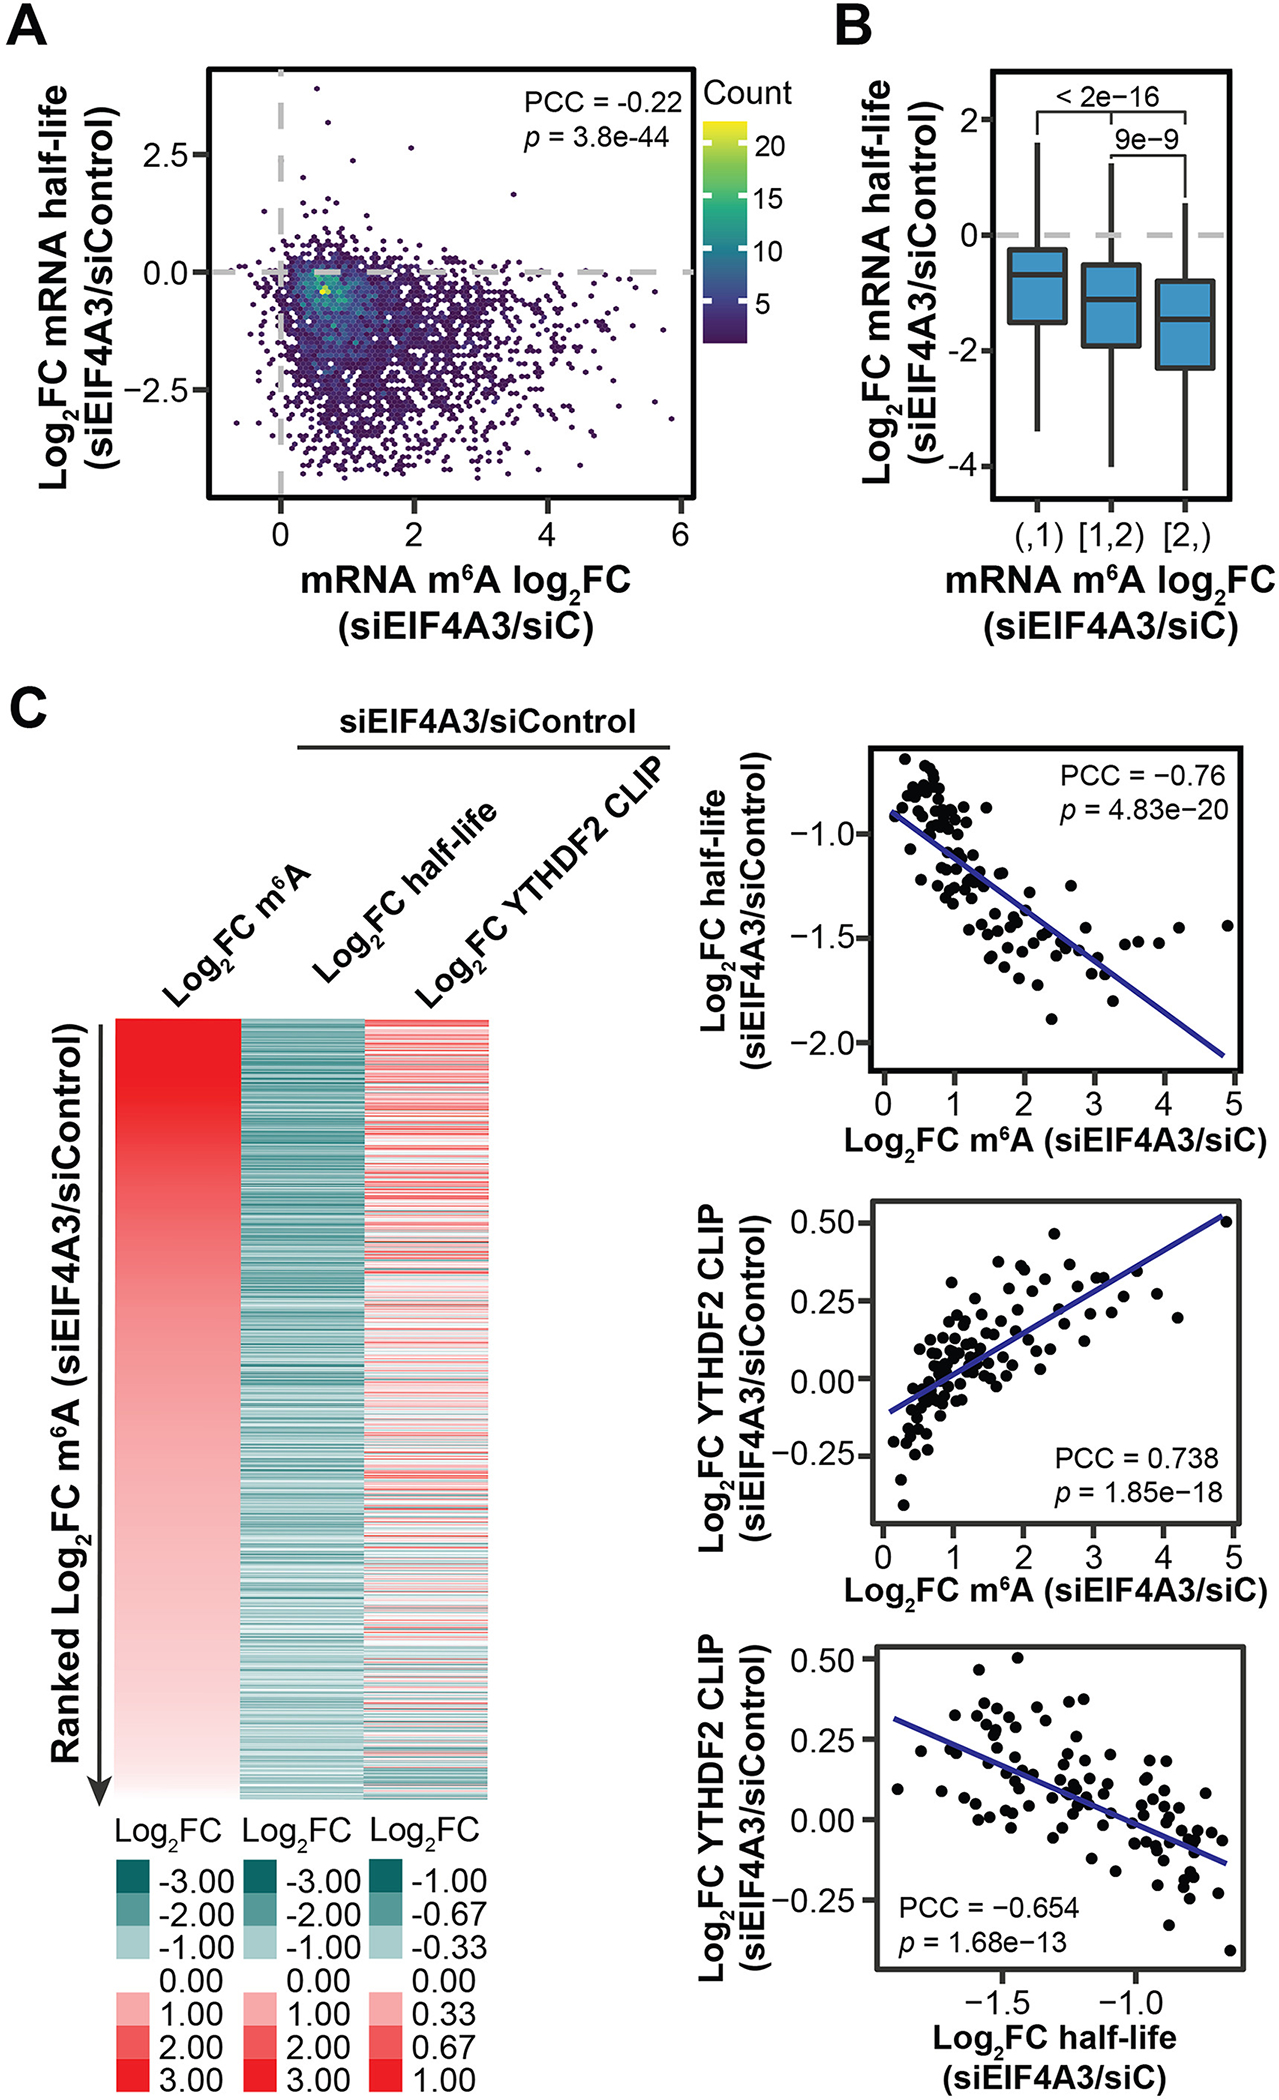
(A) Correlation between fold changes in mRNA half-life and m6A level upon EIF4A3 KD in HeLa cells (n = 3840). (B) Boxplots showing half-life fold changes of hypermethylated mRNAs upon EIF4A3 KD in HeLa cells. mRNAs were categorized into three groups according to their methylation changes upon EIF4A3 KD in HeLa cells. P values from Wilcoxon rank sum test. Sample size for each boxplot plot from left to right is: n = 1887, n = 1201, and n = 752. (C) Left: heatmap showing fold changes in m6A level, mRNA half-life, and YTHDF2 binding upon EIF4A3 KD in HeLa cells. Right: scatter plots showing the correlation among fold changes in m6A level, mRNA half-life, and YTHDF2 binding upon EIF4A3 KD in HeLa cells. The hypermethylated mRNAs (m6A log2FC > 0; n = 3424) were categorized into 100 bins based on ranked fold change of m6A level upon EIF4A3 KD. For (A) and (C), PCC and P values are shown.