
Fig. 1. Identification of farnesol as a PGC-1α inducer.
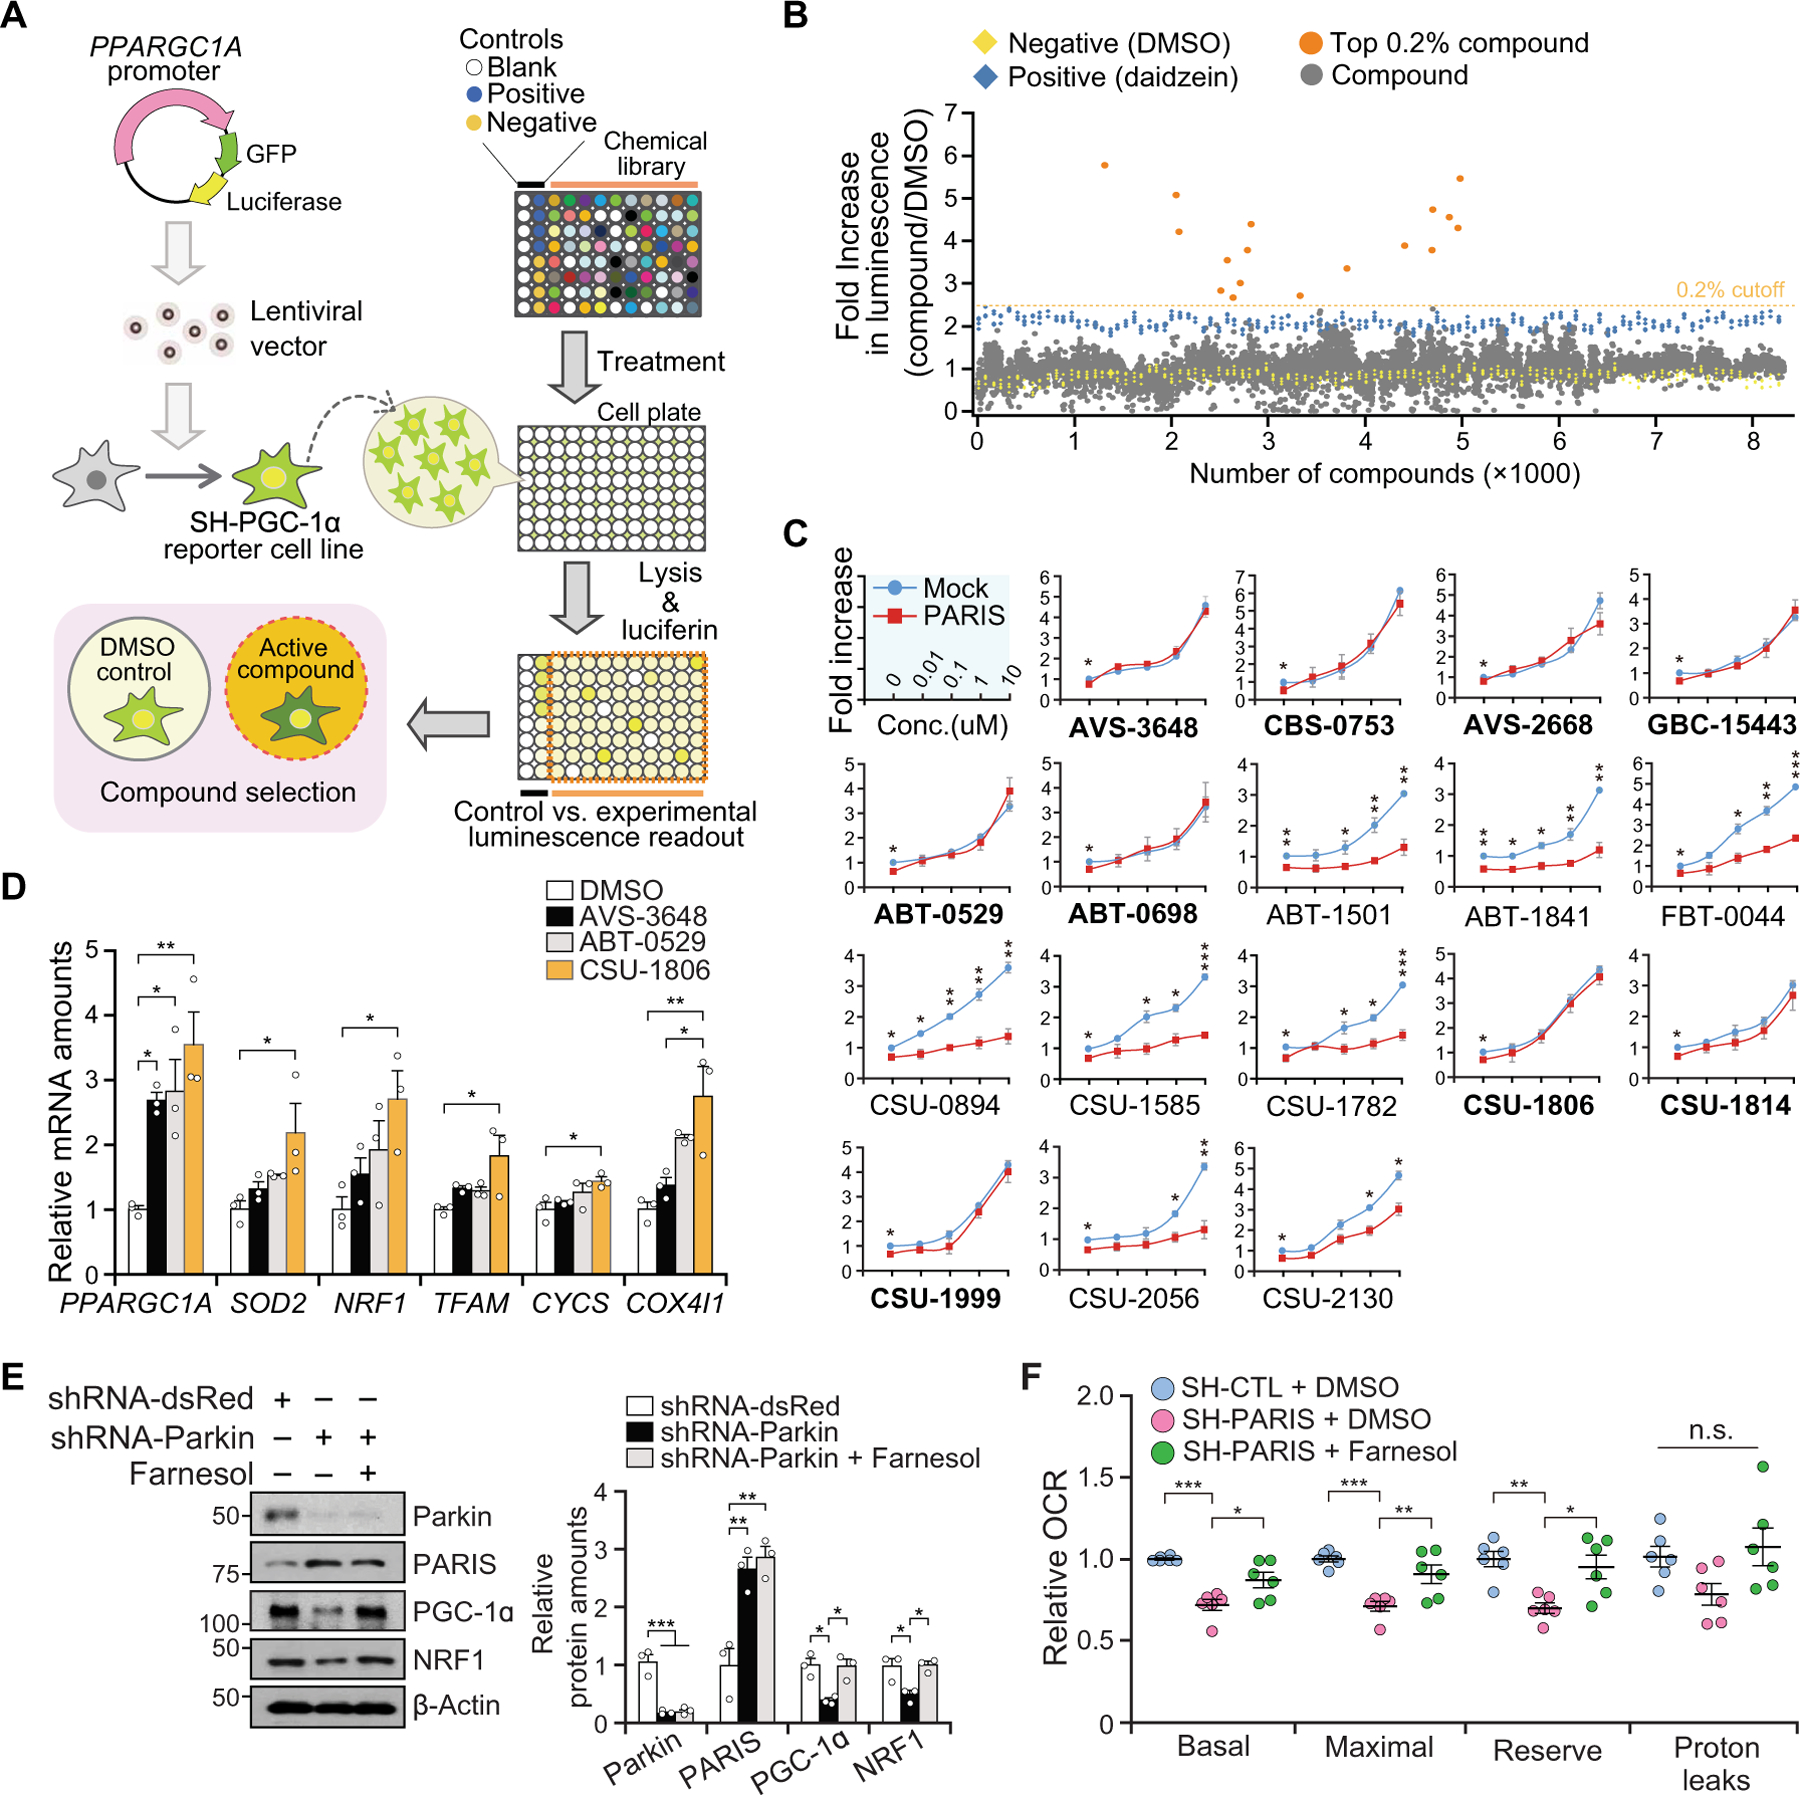
(A) Experimental illustration of compound screening. A reporter cell line (SH-PGC-1α) expressing GFP and luciferase under control of PPARGC1A promoter was used to screen for compounds that induce PPARGC1A promoter activity. (B) Promoter activity of PPARGC1A by luciferase assay. Dotted line indicates 2.5-fold activation. All readouts are displayed with color-coded shapes: yellow diamond (DMSO), blue diamond (daidzein), and gray/orange dot (experimental compounds). (C) The PPARGC1A promoter activity of the top 0.2% compounds (17 compounds) [orange dots in (B)] in the setting of overexpression of PARIS. Bold-named (nine) compounds dose-dependently increase PPARGC1A promoter activity in the presence of PARIS overexpression, n = 3 independent experiments. (D) Relative mRNA amounts of PPARGC1A and its target genes normalized to GAPDH in SH-SY5Y cells treated with DMSO, 10 µM AVS-3648, ABT-0529, or CSU-1806 (farnesol); n = 3 independent experiments. PPARGC1A, peroxisome proliferator-activated receptor γ coactivator-1α; SOD2, superoxide dismutase 2; NRF1, nuclear respiratory factor 1; TFAM, mitochondrial transcription factor A; CYCS, cytochrome c, somatic; COX4I1, cytochrome c oxidase 4. (E) Immunoblot analysis of parkin, PARIS, PGC-1α, and NRF1 in shRNA-parkin knockdown cells ± farnesol (10 µM, 48 hours) treatment normalized to β-actin; n = 3 independent experiments. Quantitation of the immunoblots in the right panel. (F) Relative oxygen consumption rate (OCR) measured by microplate-based respirometry in stable SH-SY5Y cells overexpressing PARIS (SH-PARIS) ± farnesol (10 µM, 24 hours) treatment as compared to control SH-SY5Y cells (SH-CTL), n = 6 per group. n.s., not significant. Data are expressed as means ± SEM. Statistical significance was evaluated by applying an unpaired two-tailed Student t test (C) or using one-way ANOVA with Tukey post hoc test (D to F). Differences are considered significant when P < 0.05. *P < 0.05, **P < 0.01, and ***P < 0.001. Exact P values can be found in the accompanying statistical raw data.