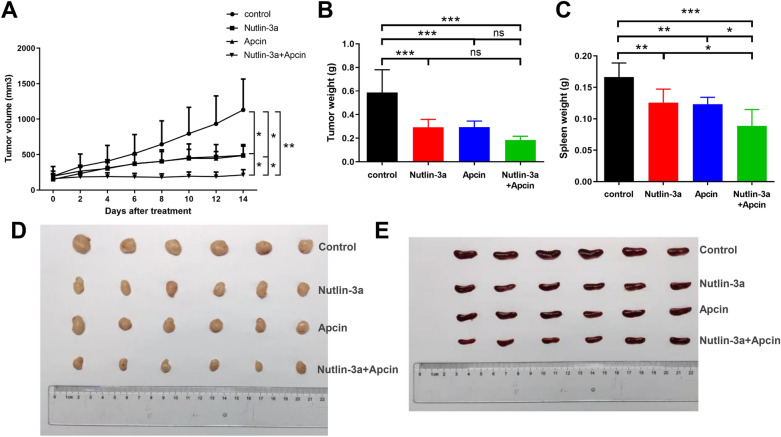
Fig. 9.
Treatment with nutlin-3a/apcin alone or in combination exerted anti-tumor effect in the Z138 cell-driven xenograft tumor model. A The tumor growth curves in the control group, the nutlin-3a group, the apcin group and nutlin-3a plus apcin group after treatment. Data were presented as mean ± SD. *P < 0.05, **P < 0.01. B Effect of treatment with nutlin-3a/apcin alone or in combination on tumor weight. Data were presented as mean ± SD. ***P < 0.001, ns meant P > 0.05. C Effect of administration with nutlin-3a/apcin alone or in combination on spleen weight. Data were presented as mean ± SD. *P < 0.05, **P < 0.01, ***P < 0.001. D, E Tumors (D) and spleens (E) in the four groups were harvested and photographed

