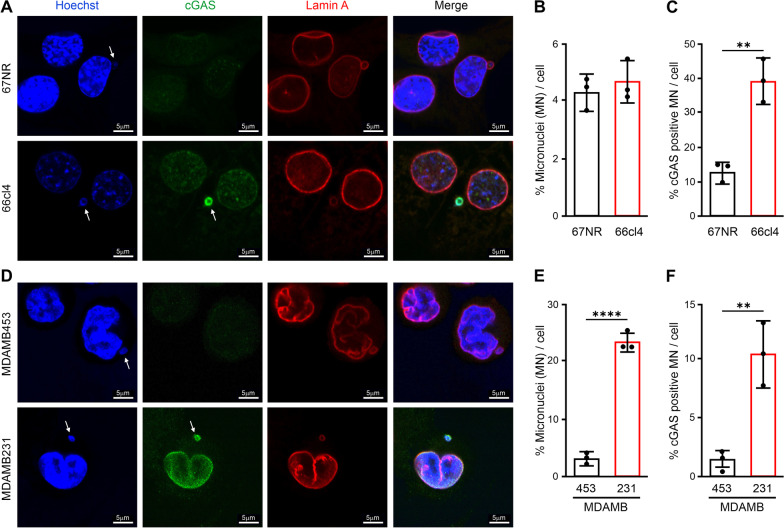
Fig. 3.
Metastatic and invasive cancer cells display elevated levels of cGAS-positive micronuclei. A Representative immunofluorescence staining of micronuclei in 67NR and 66cl4 cells with cGAS (Green) and Lamin A (red) antibodies. Micronuclei and cGAS-positive micronuclei are highlighted by white arrows. DNA was stained with Hoechst (Blue). Scale bar: 5 μm. B–C Percentage of micronuclei per cell (B) and cGAS-positive micronuclei per cell (C) calculated from three independent experiments (N = > 1000 cells per experiment, from three independent experiments). D–F Representative immunofluorescence staining and quantitation of micronuclei and cGAS-positive micronuclei in MDAMB453 and MDAMB231 cells (N = > 1000 cells per experiment, from three independent experiments). Scale bar: 5 μm. Bars represent mean ± SEM (**p < 0.01, ****p < 0.0001; Student’s t-test)

