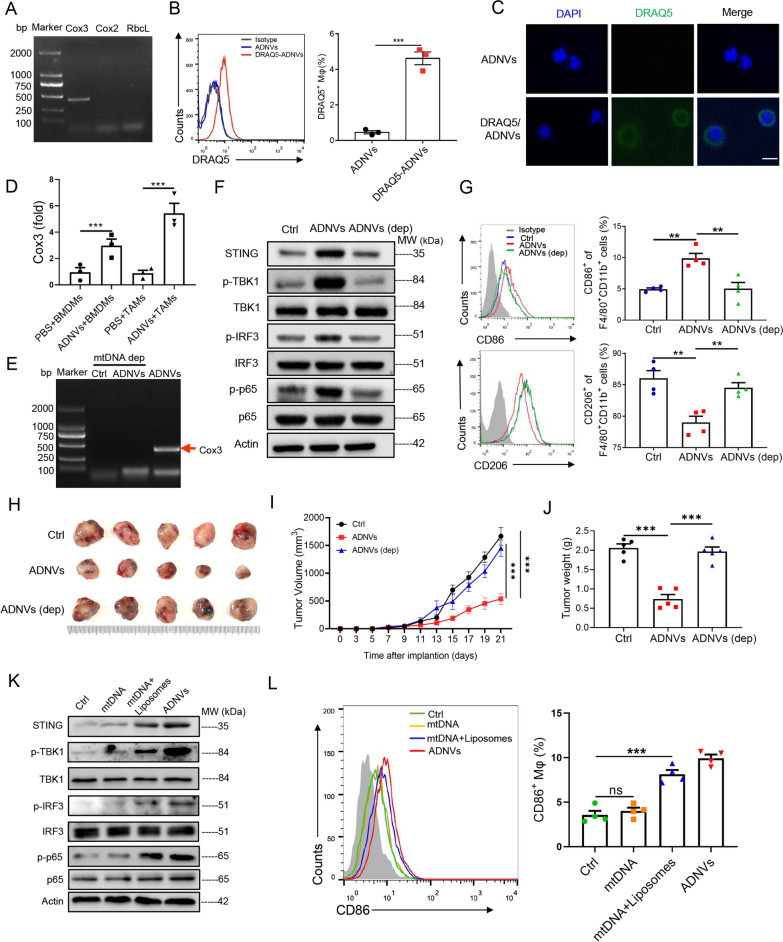
Fig. 6.
Plant-derived mtDNA activates STING pathway to drive macrophage polarization. A PCR assay of the genes Cox3, Cox2 and RbcL in ADNVs. B, C ADNVs were stained by DRAQ5 and incubated with BMDMs for 6 h. Flow cytometry and quantification of the portion of DRAQ5+ cell population (***p < 0.001, Student’s t-test) B, and immunofluorescence staining showing mtDNA-taking of DRAQ5+ cells. Nuclei: DAPI; Scale bar = 50 μm (C). D qRT-PCR analysis of Cox3 gene expression in BMDMs treated with ADNVs or vehicle, or in TAMs isolated from mice that were administrated with ADNVs or PBS. ***p < 0.001 (One-way ANOVA and Tukey’s significant difference post hoc test). E–G ADNVs were treated with or without EtBr (200 ng/mL) for 6 d to deplete mtDNA, and then applied to M2-polarized macrophages. PCR assay of Cox3 gene in ADNVs (E); Immunoblotting of STING and downstream signaling molecules (F); Flow cytometry and quantification of the percentages of M1 (CD86+) and M2 (CD206+) populations (G). **p < 0.01 (One-way ANOVA and Tukey’s significant difference post hoc test). H–J ADNVs were treated with or without EtBr to deplete mtDNA, and then injected into LLC-bearing mice (25 mg/kg, i.p.). H Gross photos of tumors at the end of experiments (21 day post LLCs inoculation. I Tumor growth profiles. ***p < 0.001 (Two-way ANOVA and Bonferroni post-tests). J Tumor weights evaluated at the end of the experiment. ***p < 0.001 (One-way ANOVA and Tukey’s significant difference post hoc test). K, L mtDNA was extracted from ADNVs, coated with or without liposomes and then applied to M2-polarized macrophages for 24 h. Immunoblotting of STING and downstream signaling molecules (K); Flow cytometry and quantification of the percentage of M1 (CD86+) populations (L). ns: non-significant, ***p < 0.001 (One-way ANOVA and Tukey’s significant difference post hoc test). The results are from one of two or three independent experiments. Representative images are shown and the data are presented as means ± SEM

