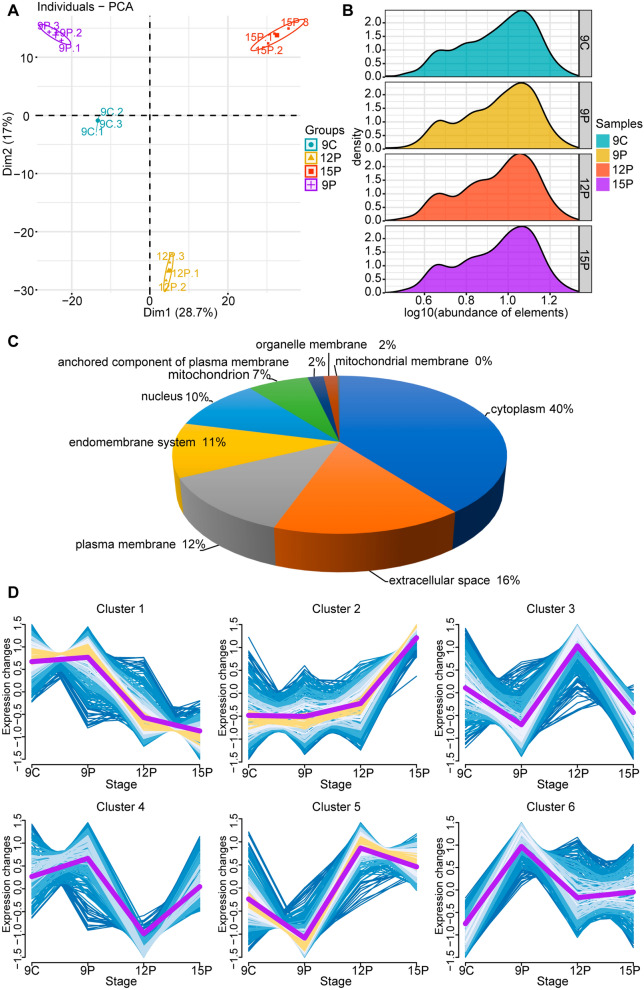
Fig. 2.
Global identification of proteins in ULF-EVs. A Principal component analysis of total proteins in ULF-EVs. B Kernel density estimation of the relative abundance of proteins in ULF-EVs in four different periods. C Pie chart of intracellular protein locations, which were predicted by BUSCA software. D Protein dynamics of ULF-EVs in four different stages. Global proteins were clustered into six soft partitioning clusters, with distinct clusters falling into different biological functions based on abundance patterns. The purple line represents the abundance trend of the proteins in the cluster

